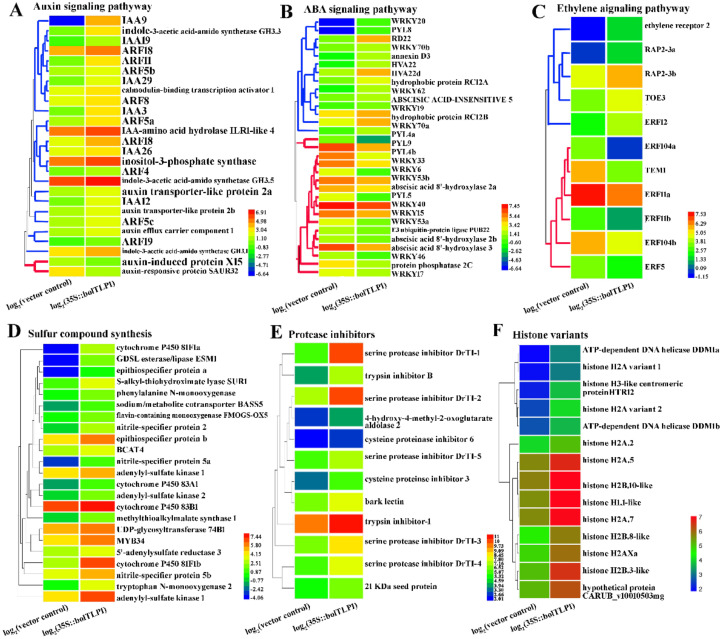
Figure 6.
Transcriptional expression patterns of the differentially expressed genes involved in phytohormone-mediated signaling pathways (A–C), sulfur compound synthesis (D), protease inhibitors (E) and histone variants (F). The blue and red branches in (A–C) indicated the genes displayed significantly up-regulated and down-regulated expression in the 35S::bolTLP1 broccoli compared with the vector control (corrected p-value < 0.01), respectively. Log2 (35S::bolTLP1) and log2 (vector control) indicated the log2FPKM of bolTLP1 in 35S::bolTLP1 broccoli and vector control plants, respectively, which represents the normalized expression level of bolTLP1 detected by RNA-seq.

