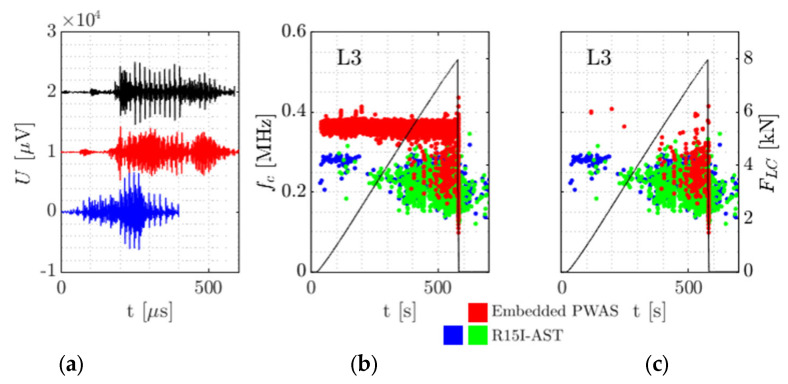
Figure 9.
Noise mitigation on specimen L3: (a) Three waveforms measured in the reference timeslot between 162 s and 242 s after the start of test. They are translated in time and voltage to fit in the same image. The dissimilarity between the waveforms is between 0.65 and 0.79. (b) Centroid frequency fc of all measured signals over time and load cell force for the embedded sensor and the two R15I-ASTs. (c) Equivalent to (b), but with noise removed.

