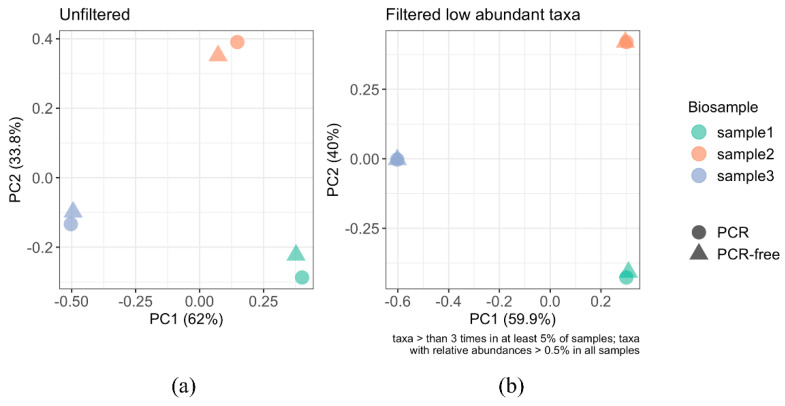
Figure 6.
PCoA analysis of the faecal (intestinal) viromes from PCR and PCR-free datasets. The PCoA plots were based on Bray–Curtis distances and were used to interpret the intestinal/faecal virome-derived datasets. (a) PCoA of the unfiltered data and (b) PCoA plot after removing <0.5% abundant taxa.

