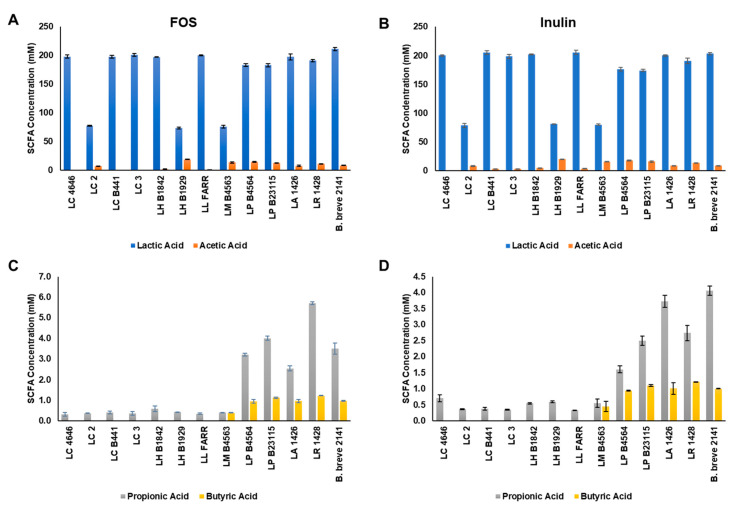
Figure 4.
Short-chain fatty acid production by the ten Lactobacillus strains capable of fermenting both (A,C) FOS and (B,D) inulin. Bars represent the average concentration of each SCFA (nM): lactic (blue bars), acetic (orange bars), propionic acids (gray bars), and butyric acids (yellow bars) as the average of three replicates (±standard deviation).

