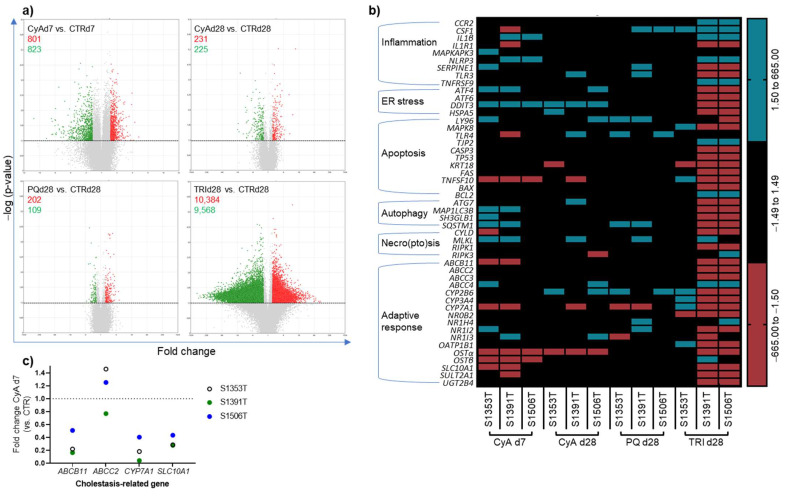
Figure 4.
Transcriptomic analysis of PHH spheroids exposed to CyA 5 µM, PQ 2 µM and TRI 100 µM during 7 and/or 28 days. (a) Volcano plots displaying the differentially expressed genes between treated spheroids and the respective control, considering all donors. Significance was set at absolute fold changes above 1.5, with a p-value below 0.05 and an FDR p-value below 1, calculated via one-way ANOVA followed by post hoc tests using Bonferroni’s correction and Benjamini–Hochberg correction (green: downregulation; red: upregulation). (b) Heat-map displaying donor-by-donor compliance with the AOP on drug-induced cholestasis. At least 75 spheroids were used per donor and per condition. Absolute fold changes above 1.5 were considered significant. (c) RT-qPCR results confirming the effects of a 7-day exposure to CyA 5 µM on genes encoding canalicular transporters ABCB11 (BSEP) and ABCC2 (MRP2), uptake transporter SLC10A1 (NTCP), and CYP7A1, the main enzyme involved in BA synthesis and homeostasis. All the gene names are listed in Table S2 in the supplementary materials. ABC—ATP binding cassette; AOP—adverse outcome pathway; BSEP—bile salt export pump; CyA—cyclosporine-A; CYP—cytochrome P450; d—day; FDR—false discovery rate; MRP—multidrug resistance-associated protein; NTCP—sodium-taurocholate co-transporting polypeptide; PQ—paraquat, SLC—solute carrier; TRI triclosan.

