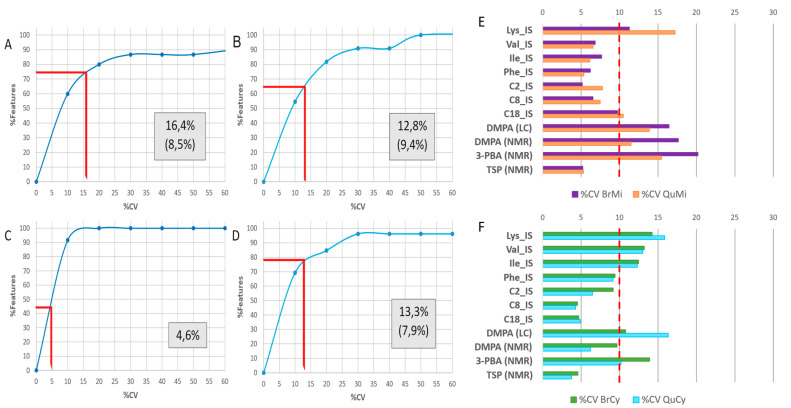
Figure 2.
Technical variance and data quality for each 1H-NMR and LC-MS/MS batch. (A) Cumulative percentage features plotted over coefficient of variance (%CV) intervals—from QC sample technical replicates within 1H-NMR mitochondrial and (B) cytosolic sample batches. The same is plotted for (C) LC-MS/MS mitochondrial and (D) cytosolic batches as well. Enclosed numbers indicate mean %CV values across all viable features in each dataset—where individual unstable features were filtered, the number in brackets indicates the adjusted mean %CV after filtering. Measured IS compound variance as %CV in each tissue matrix, (E) for the mitochondrial and (F) cytosolic samples. Deuterium-labeled standards: C2_IS: d3-acetylcarnitine, C8_IS: d3-octanoylcarnitine, C18_IS: d3-stearoylcarnitine, Ile_IS: d10-isoleucine, Lys_IS: d4-lysine, Phe_IS: d5-phenylalanine, Val_IS: d3-valine. Other standards: DMPA: N,N-dimethylphenylalanine, 3-PBA: 3-phenylbutyric acid, TSP: 3-(trimethylsylil) propionic acid.

