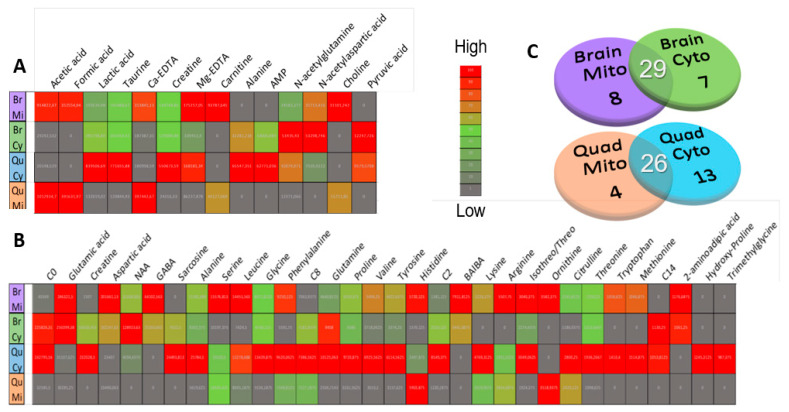
Figure 3.
Comparison of viable metabolite presence and gross abundance across sample matrices. Venn diagrams in (C) show the number of metabolites viably detected above the noise level in mitochondria, cytosols and both compartments for the whole-brain and quadriceps matrices, separately. Heatmaps of average matrix raw peak abundances, contrasted by Euclidian between-mean distances, are presented for the (B) total viable LC-MS/MS and (A) 1H-NMR features. Br.C and Br.M abbreviate averages for whole-brain cytosolic and mitochondrial fractions, respectively, and Qu.C and Qu.M indicate quadriceps muscle cytosolic and mitochondrial groups.

