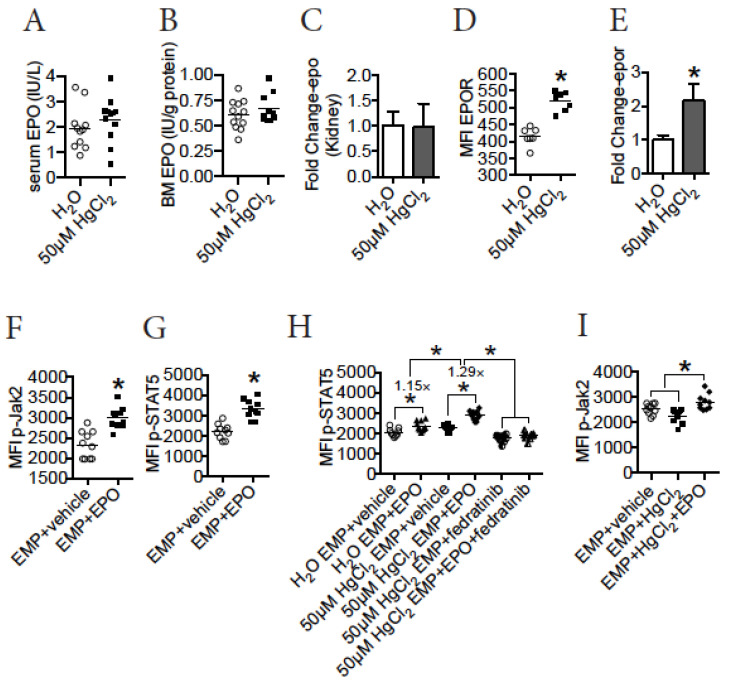
Figure 6.
HgCl2 does not impact the production of EPO, but increases the expression of EPOR in EMPs in B10.S mice. EPO protein in the serum and BM, EPO mRNA in the kidney, and EPOR in EMPs in the BM in B10.S mice treated with 50 μM HgCl2 or the control for 4 w were measured. FACS-purified EMPs from the BM of B10.S mice were treated with HgCl2 or vehicle or EPO in vitro, and the Jak2/STAT5 signaling pathway and differentiation of EMPs were measured thereafter. (A) EPO protein (IU/L) in the serum of B10.S mice treated with 50 μM HgCl2 or water for 4 w. (B) EPO protein (IU/g protein) in the BM of B10.S mice treated with 50 μM HgCl2 or water for 4 w. (C) EPO mRNA (fold change) in the kidney of B10.S mice treated with 50 μM HgCl2 or water for 4 w. (D) The expression of EPOR (MFI) in EMPs in the BM of B10.S mice treated with 50 μM HgCl2 or water for 4 w. (E) The expression of EPOR mRNA (fold change) in FACS-purified EMPs from the BM of B10.S mice treated with 50 μM HgCl2 or water for 4 w. (F) EMPs were purified from the BM of control B10.S mice, and the FACS-purified EMPs were treated thereafter with EPO or vehicle in vitro for 16 h. After that, the expression of p-Jak2 (MFI) in EMPs was measured. (G) EMPs were purified from the BM of control B10.S mice, and the FACS-purified EMPs were treated thereafter with EPO or vehicle in vitro for 16 h. After that, the expression of p-STAT5 (MFI) in EMPs was measured. (H) EMPs were purified from the BM of B10.S mice treated with 50μM HgCl2 or water for 4 w, and the EMPs were treated thereafter with EPO or vehicle in the presence or absence of the Jak2 inhibitor fedratinib for 16 h in vitro. After that, the expression of p-STAT5 (MFI) in the EMPs was measured. (I) EMPs were purified from the BM of control B10.S mice, and the FACS-purified EMPs were treated thereafter with HgCl2 and/or EPO or vehicle in vitro for 16 h. After that, the expression of p-Jak2 (MFI) in EMPs was measured. Each dot represents one mouse or one sample, and a total of 5 to 12 mice or samples were used for each group. Asterisk indicates a significant difference compared to the counterpart control group. p < 0.05 was considered as the level of significant difference.

