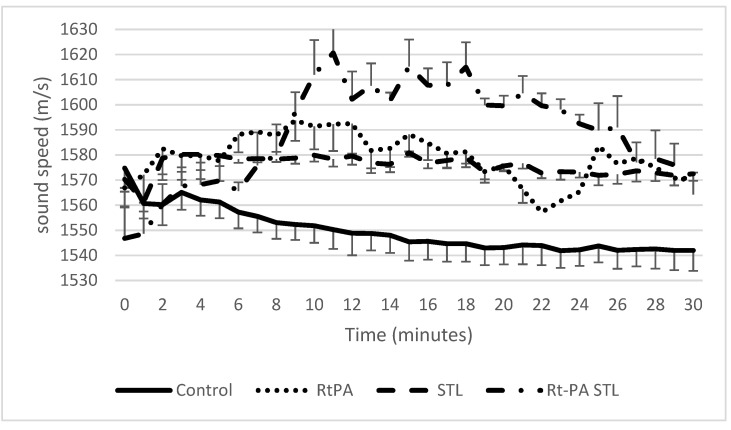
Figure 4.
Measured SoS in the clot for the four different groups. Data expressed as mean ± standard error of the mean (SEM) were calculated from four independent experiments. Considering the control group, SoS decreases during the 30 min of the experiment, while it increases moderately in groups RtPA and STL. The rtPA-STL group shows the greatest increase of SoS at 10 min, and then shows a plateau before decreasing.

