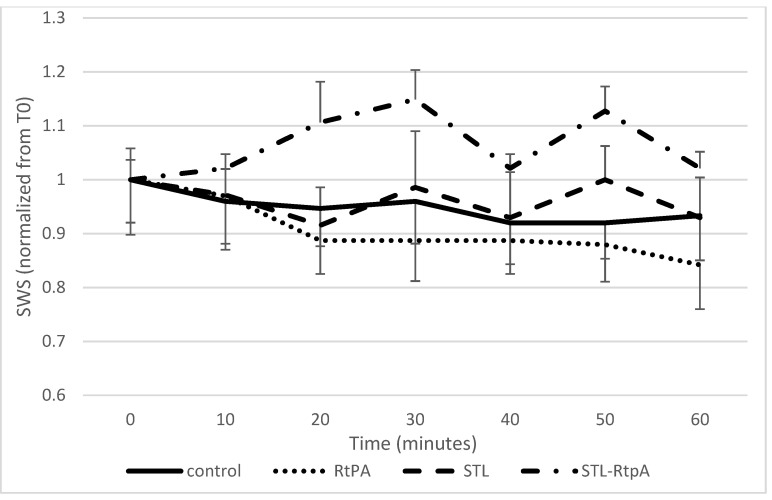
Figure 7.
Measured SWS for the four experimental conditions, normalized to the initial value to better appreciate the effects of each condition independently from initial sample variability. This curve shows the evolution of SWS for 60 min. Data expressed as mean ± SEM were calculated from four independent experiments. Considering the rtPA group, SWS decreases during the 30 min of the experiment, while it decreases more moderately for groups RtPA and STL. The rtPA-STL group shows the greatest increase of SWS at 30 min.

