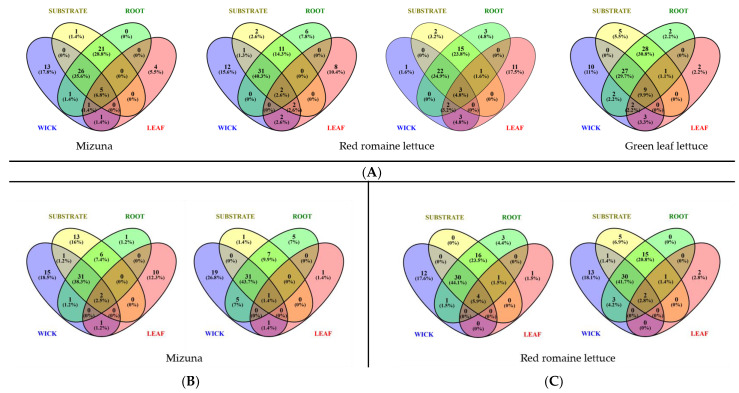
Figure 9.
Venn diagrams revealing unique and shared genera across the 3 tech demos and crop types. (A) VEG-03D samples, (B) VEG-03E samples, (C) VEG-03F samples. Diagrams depict plant and corresponding pillow components (wick, substrate, and root tissue). Numbers are the number of genera with greater than 50 sequencing reads. The % is the percent total reads. Venn diagrams were completed with Venny v 2.1.

