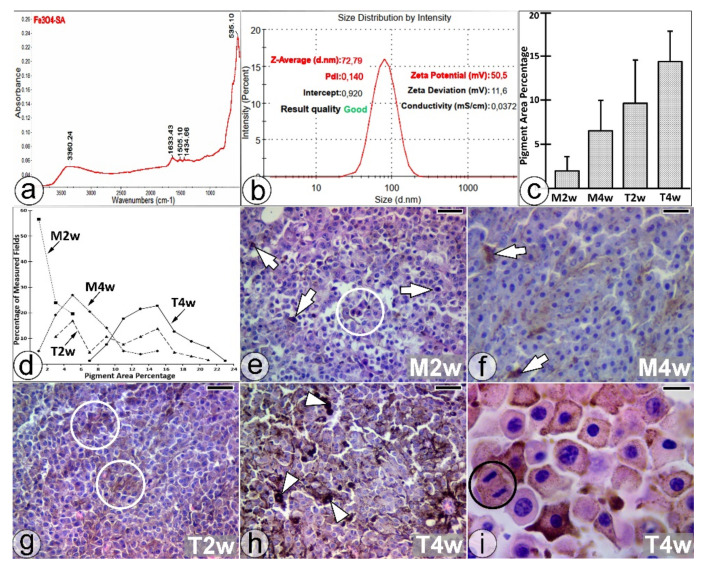
Figure 1.
(a) FT-IR spectra and (b) the DLS size and zeta potential measurements of SaIONs. (c) PAP mean values (± SD) and (d) percentage ranges of the PAP distribution in the measured fields. (e–i) Histological sections through untreated (M2w and M4w) and orally treated (T2w and T4w) melanoma tissue, with single PMCs (white arrows), PMC clusters (white circles), HPMCs (white arrow-heads), and PMC mitosis (black circle) highlighted. HE staining. Bar = 25 µm (e–h); 10 µm (i).

