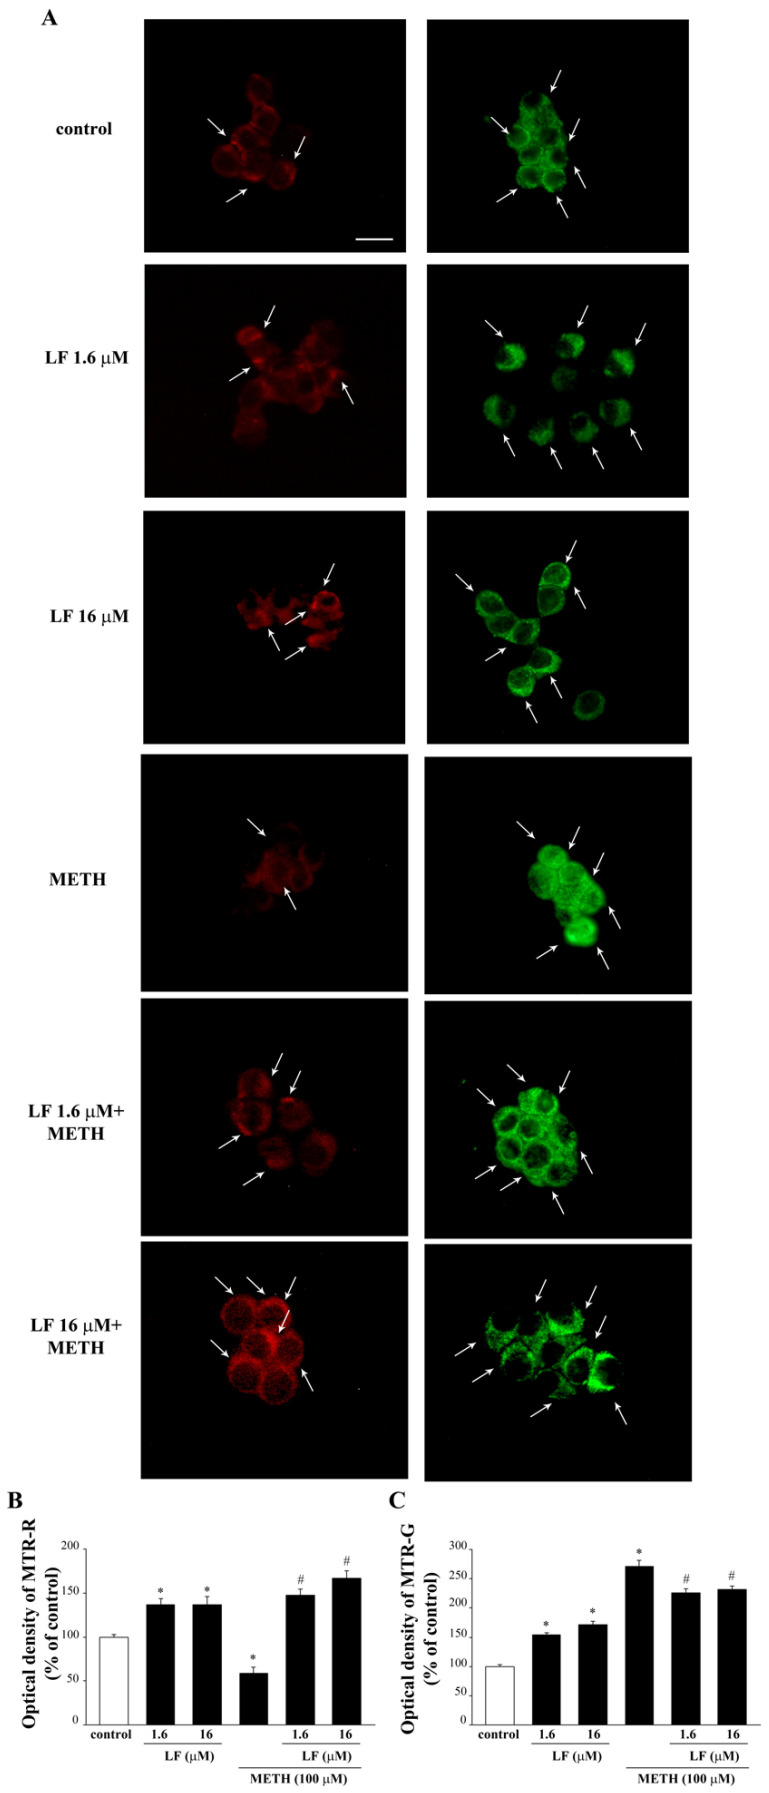
Figure 9.
Mito Tracker-fluorescence after combined METH and LF administration. (A) Representative pictures of Mito Tracker Red and Mito Tracker Green fluorescent cells, which label healthy and total mitochondria, respectively. Arrows indicate intensely MTR-R or MTR-G-stained cytosolic spots. Optical density of Mito Tracker Red (B) and Mito Tracker Green (C). MTR-R = Mito Tracker Red; MTR-G = Mito Tracker Green. * p < 0.05 compared with control; # p < 0.05 compared with METH. Scale bar = 13 μM.

