Figure 6.
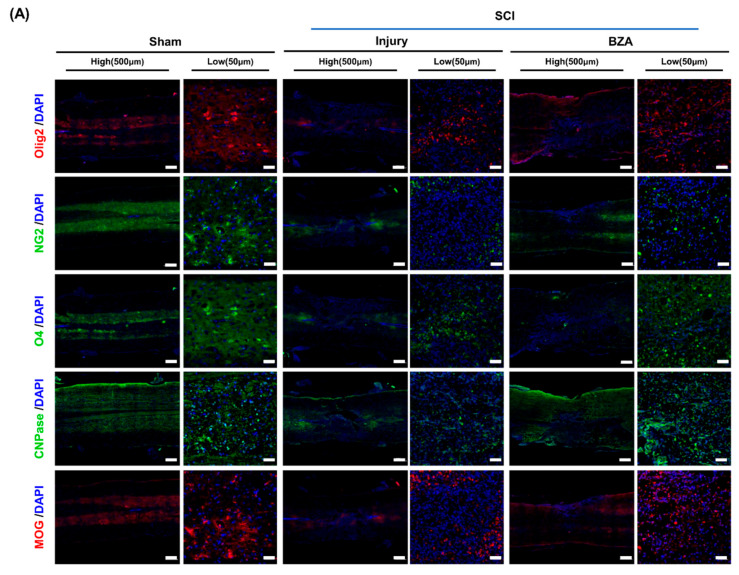
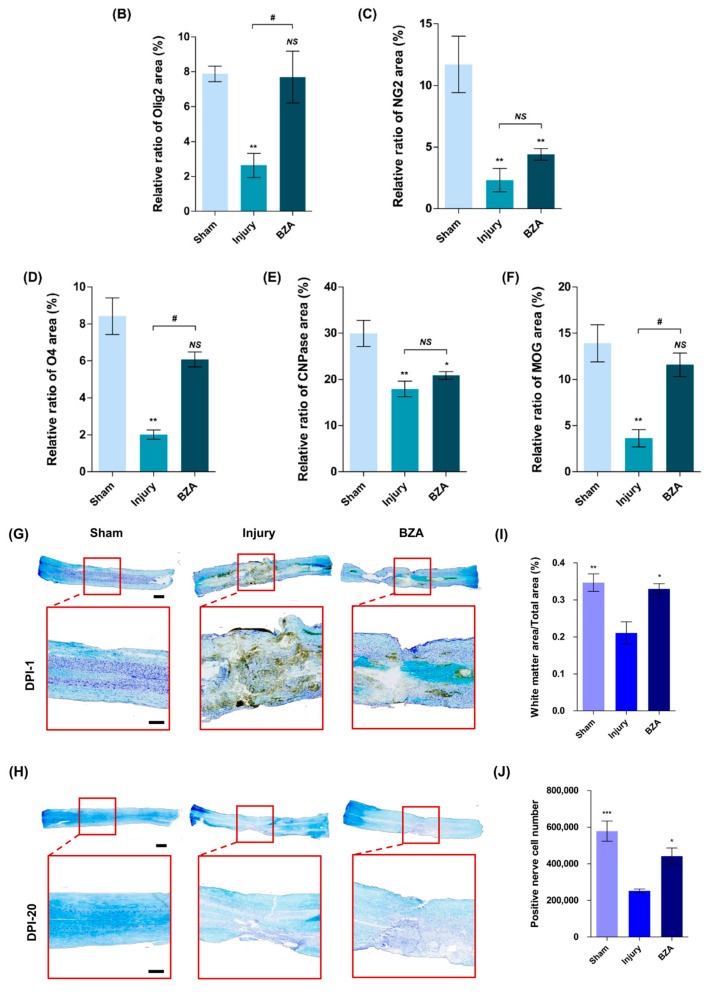
BZA enhances remyelination after SCI. For a quantitative analysis of the formation of oligodendrocytes responsible for myelination, the spinal cord samples at dpi 20 were sectioned and immunostained. (A) Representative images of oligodendrocyte differentiation marker Olig2, the mature oligodendrocyte markers NG2, O4, CNPase, and the myelin marker MOG in the sham, injury, and BZA groups. (B–F) The percentage (%) of each antibody area to the total area of the immunofluorescence (IF) quantification graph. (B) Olig2, (C) NG2, (D) O4, © CNPase. (F) MOG. (G,H) Representative images of Luxol fast blue (LFB) staining at dpi 1 and dpi 20 in the sham, injury, and BZA groups. (I) Percentage graph of white matter that could be confirmed as myelin compared to the total area of sham, injury, and BZA groups at dpi 20, (J) A graph confirming the number of positive cells representing nerve cells at dpi 20. IF results of the graph confirmed the significance between the sham group and the injury and BZA groups. (LFB results = injury vs. sham, BZA). Data represents mean ± SEM (n = 3–4 (B,C), 3 (D), 5–6 (E), 3–6 (F), 4 (G–J)/group). * p < 0.05, ** p < 0.01, *** p < 0.001 (sham vs. injury, BZA; (A–F), injury vs. sham, BZA; (G–J). # p < 0.05 (injury vs. BZA; (A–F), NS = Not significant, one-way ANOVA followed by the Bonferroni test.


