Figure 1.
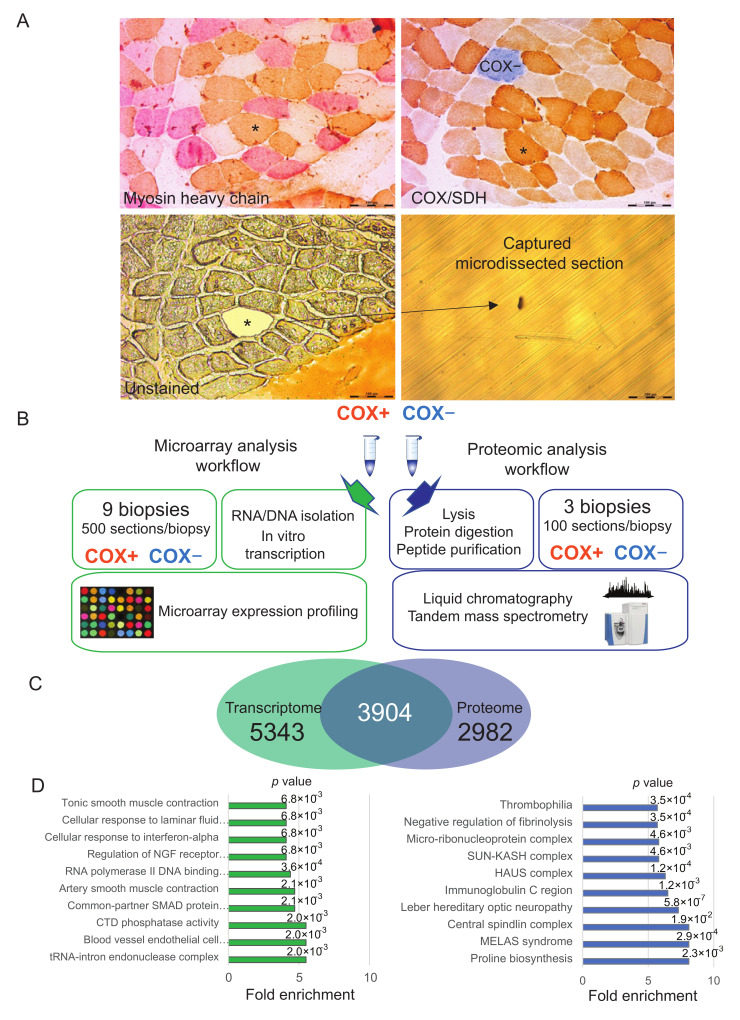
Laser capture microdissection-based workflows and features of the datasets. (A) Serial sections of skeletal muscle from a patient suffering from chronic progressive external ophthalmoplegia CPEO. Top left, myosin heavy chain staining for fiber type (brown, type 1-slow fibers; pink, fast-2A fibers.; white, fast-2X fibers). Top right, cytochrome c oxidase (COX)/succinate dehydrogenase (SDH) staining. Bottom left, unstained serial section used for laser microdissection as indicated. The fiber labeled with an asterisk in the serial sections was microdissected, as schmatically depicted Bar, 200 µM. (B) Schematic representation of the workflow of laser capture microdissection coupled to both the transcriptome analysis presented here and our previous proteomic dataset. Pools of 500 COX+ and COX- fibers were obtained from 9 patients for transcriptome data and pools of 100 from 3 patients for proteome data. (C) Venn diagram of data integration, showing the gene products quantified both at the transcriptome and proteome level and those unique for each dataset. (D) Top ten annotations significantly enriched in the gene products quantified only in the transcriptome (left, green) and only in the proteome (right, blue). p value is reported on top of each corresponding bar. Fisher exact test, Benjamini-Hochberg FDR = 0.02 for truncation.

