Figure 4.
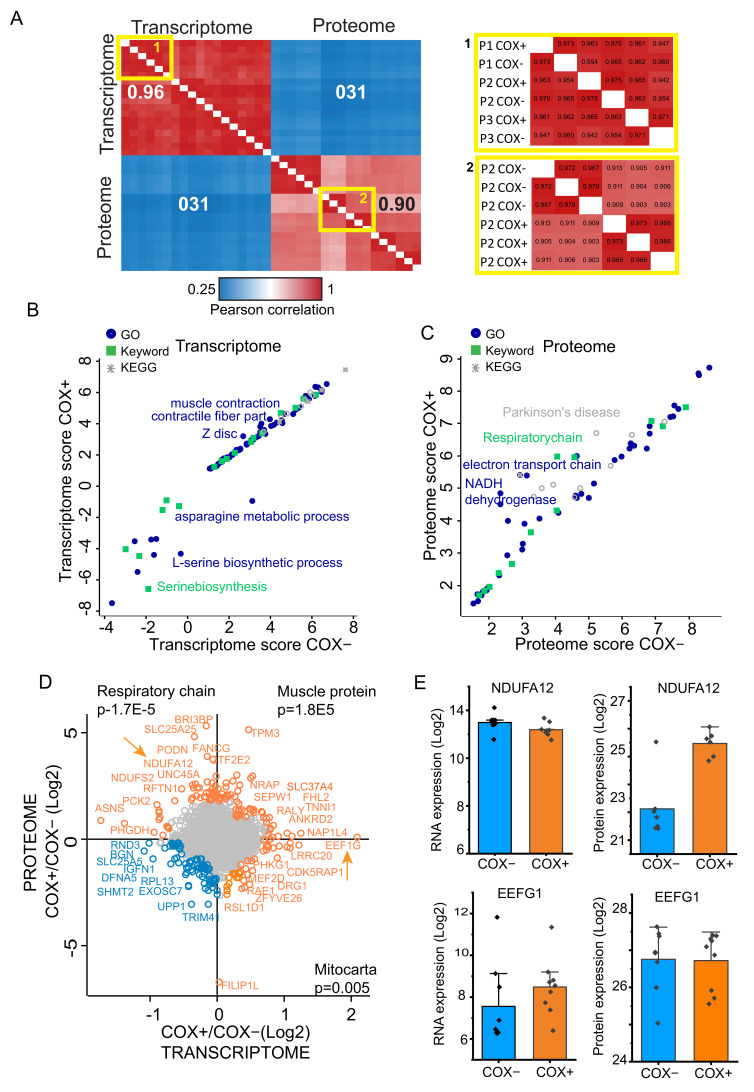
Integration of dataset and multi-omics analysis of common gene products. (A) Multi-scatter plot-based heatmap of Pearson correlations among all transcriptome and proteome single run. n = 9 patients for transcriptome. n = 3 patients for proteome. Pearson correlation color scale is displayed at bottom. Insets on the right show enlarged areas of the main heatmap (areas with yellow borders). (B) Scatter plot of 2D annotation enrichments comparing cytochrome oxidase (COX)+ and COX- fibers at the transcriptome level (n = 9 patients). Functional annotations (GO, Keywords, and KEGG) are labeled with different shapes and color as indicated in the legend top left. (C) Scatter plot of 2D annotation enrichments comparing COX+ and COX- fiber at the proteome level (n = 3 patients). Legend, see panel B. (D) Scatter plot of Log2 COX+/COX- ratio directly comparing transcriptome and proteome features. Top right quadrant: higher expression in COX+ at both transcriptome and proteome level. Top left quadrant, high in COX+ at the proteome level. Bottom right quadrant, high expression in COX+ at the transcriptome level. Top enrichment with p values is shown for the three quadrants. Scatter plot of Log2 COX+/COX- ratio directly comparing transcriptome and proteome features. Top right quadrant: higher expression in COX+ at both transcriptome and proteome level. Top left quadrant, high in COX+ at the proteome level. Bottom right quadrant, high in COX+ at the transcriptome level. Top enrichment with p values is shown for the three quadrants. Two arrows indicate gene products analyzed in more detail. (E) Bar graph of Log2 individual data points comparing the RNA (left column) and protein expression (right column) of NDUFA12 and EEFG1, two gene products indicated by an arrow in panel D. Bars show the median expression, whiskers the standard deviation. n = 9 patients for transcriptome. n = 3 patients, each in technical triplicates, for proteome.

