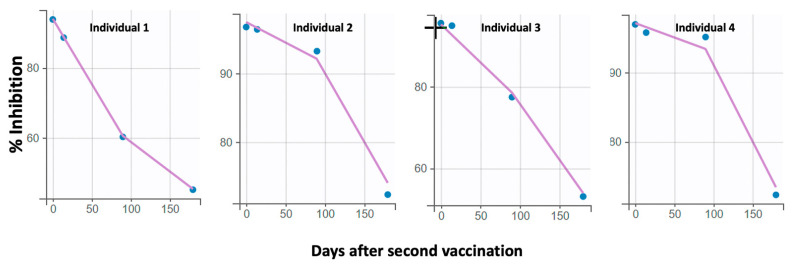
Figure 3.
Representative individual profiles of Nabs values (% inhibition) versus time. The solid lines refer to the values predicted by the model, while the circles represent the observed Nabs levels. The good descriptiveness of the model is expressed by the close passage of the line predicted by the model to the actual points.

