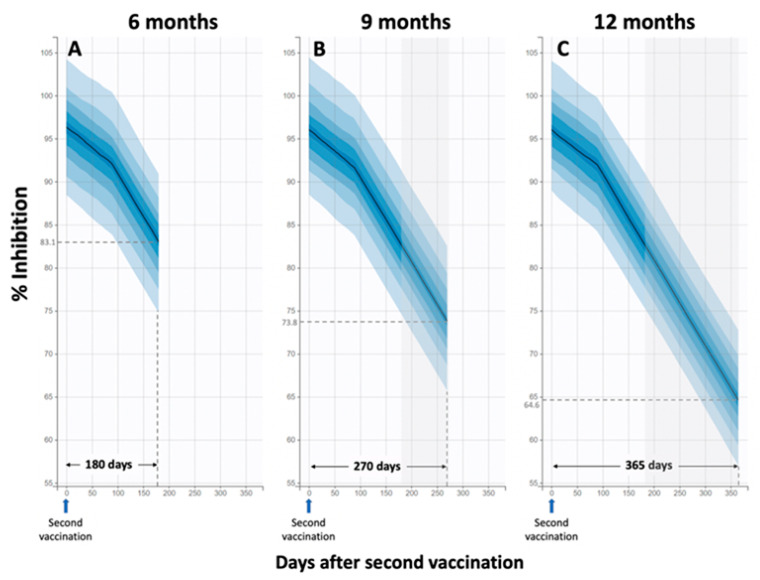
Figure 5.
Observed and simulated Nabs levels over a period of several months. Simulations were performed for 6 months (A), 9 months (B), and 12 months (C) after the second vaccination. The first elimination constant (kel1) was determined to be 0.017 Nabs/day (standard error = 0.002) and referred to the initial decay phase up to 3 months. Thereafter, the elimination constant was kel2 = 0.097 Nabs/day (standard error = 0.007). Simulated inhibition (%) levels versus time for three different time frames: six, nine and twelve months. At 6 months, the predicted median of 83.1% is quite close to the observed median of 81.0%. For the predictions 9 and 12 months after injection, it is assumed that the kinetic parameters remain the same as observed in the interval 3–6 months.

