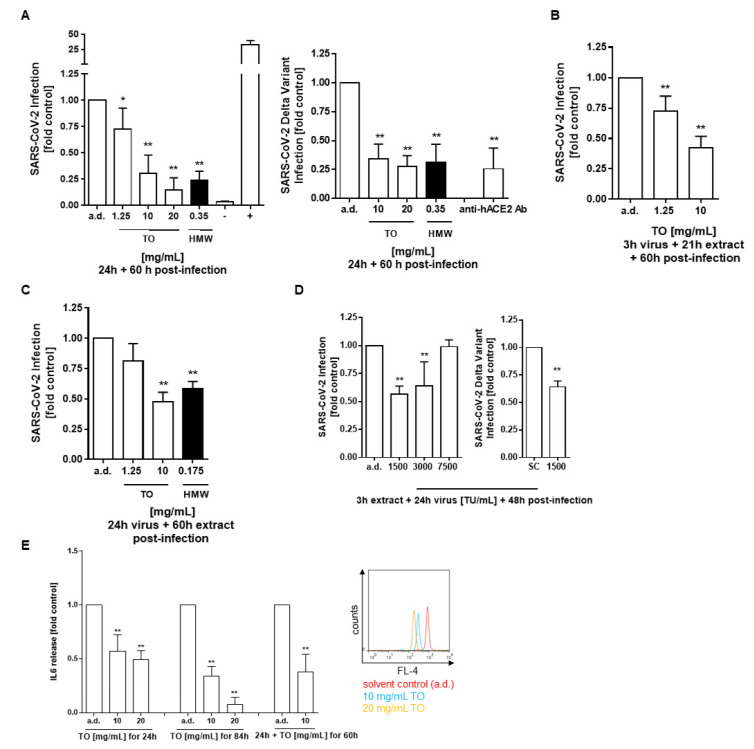
Figure 6.
Viral transduction inhibition of A549-hACE2-TMPRSS2 cells by T. officinale extract. (A) Cells were pre-treated with T. officinale (TO) or HMW extract for 0.5 h before infection with 7500 TU/mL SARS-CoV-2 spike D614 or Delta (B.1.617.2) variant for 24 h; (B,C) Cells were transduced with 7500 TU/mL SARS-CoV-2 for (B) 3 h before addition of TO for another 21 h or (C) 24 h. After transduction, the medium was exchanged with fresh medium containing TO or HMW extract at the indicated concentrations and post-incubated for 60 h. (D) Cells were pre-treated with 40 mg/mL TO for 3 h before transduction with the indicated virus titer for 24 h. After that, the medium was exchanged with fresh medium and incubated for another 48 h. Luminescence was then detected within 1 h. 0.35 mg/mL HMW extract equals to 20 mg/mL TO extract. Transduction control: (−) negative control: bald lentiviral pseudovirion; (+) positive control: firefly luciferase lentivirus; inhibitor positive control: 100 µg/mL anti-hACE2 antibody. (E) Pro-inflammatory IL-6 cytokine secretion analysis was done either after 24 h virus transduction together with extract (left), after 24 h + 60 h post-infection with extract (middle) or after 60 h post-infection with extract (right) using multiplexing flow cytometric analysis. Solvent control: distilled water (a.d.). N ≥ 3 independent experiments; * p < 0.05, ** p < 0.01. Significance of difference was calculated relative to the solvent control by one-way ANOVA.

