Figure 1.
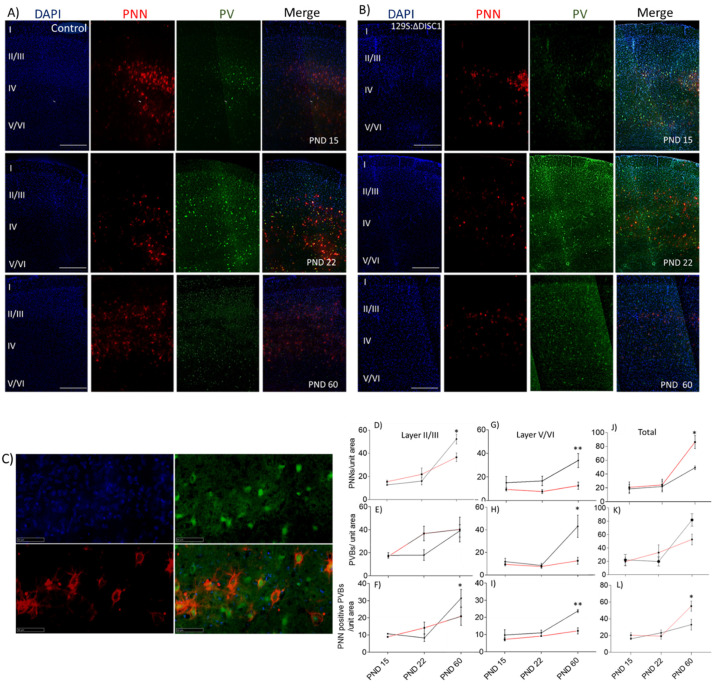
Representative immunofluorescent images and quantification. (A,B) control and DISC1 mutation: ∆DISC1 age wise representation from postnatal day (PND) 15, 22, and 60, respectively; (C) high magnification image showing colocalization of PNN (red)/PV (green) /DAPI (blue). Roman numerals I–VI indicate cortical layers 1–6, respectively; (D–I) quantitative analysis of PNN, PVs and colocalization of the two in layers II-VI. (J–L) Total PNNs, PVBs and colocalization in PFC layers Black and red lines indicate Control and DISC1 mutation animals, respectively. The data are represented as a scatter line plot showing mean ± s.e.m. where * p ≤ 0.05, ** p ≤ 0.01, by one way-ANOVA.

