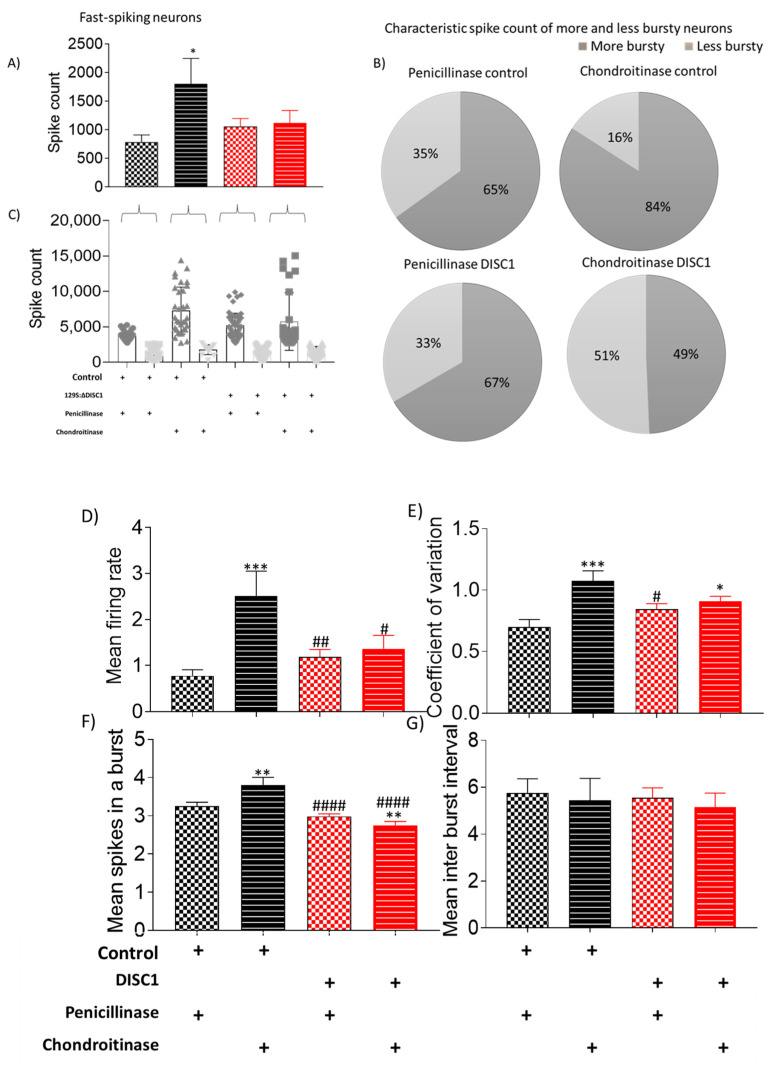
Figure 6.
Characteristic of fast-spiking neurons. (A–C) spike count in recorded potentials and pie chart representing distribution of high and low spike count over and below threshold from respective groups; (D–G) exhibiting mean firing rate, coefficient of variation, and mean spikes in a burst and mean inter-burst interval, respectively. The data are shown as mean ± s.e.m. where * or # p ≤ 0.05, ** or ## p ≤ 0.01, *** p ≤ 0.001 and #### p ≤ 0.0001. * Represents comparison vs. penicillinase control and # represents comparison vs. chondroitinase control.

