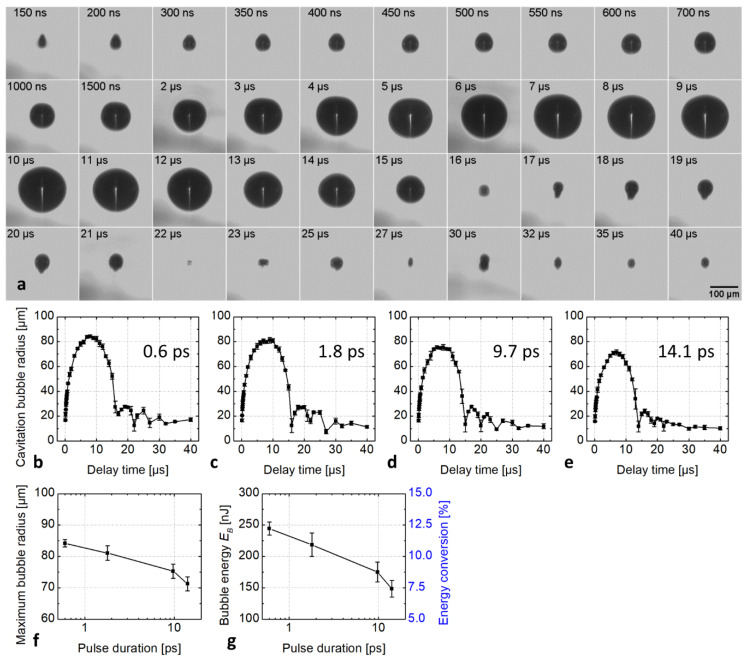
Figure 2.
(a) Time-resolved images of the cavitation bubble initiated by a 600 fs laser pulse. The laser pulse energy was kept constant at 2.0 µJ and the focus was located 1 mm below the hydrogel surface. The cavitation bubble development at a pulse duration of 1.8, 9.7, and 14.1 ps is similar to that at 600 fs and can be found in Figures S2–S4. (b–e) Plots of the cavitation bubble radius generated at different pulse duration versus the delay time. (f) The plot of the obtained maximum cavitation bubble radius in the hydrogel and (g) the bubble energy and the corresponding energy conversion efficiency as a function of pulse duration.

