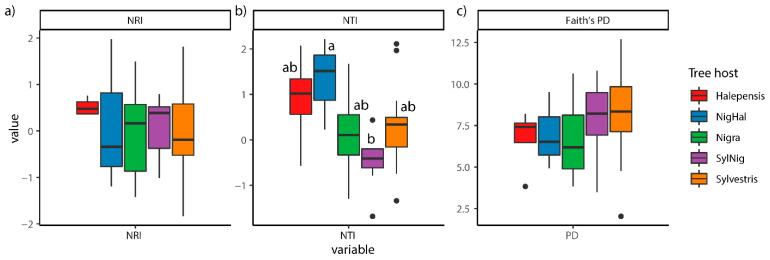
Figure 3.
Boxplots displaying (a) Net Relatedness Index (NRI) values (b) Nearest Taxon Index (NTI) (c) Faith’s PD values between tree host species (Halepensis: P. halepensis, NigHal: P. nigra-halepensis, Nigra: P. nigra, SylNig: P. sylvestris-nigra and Sylvestris: P. sylvestris). Means were compared using ANOVA and Tukey’s HSD tests, with letters denoting significant differences between host species.

