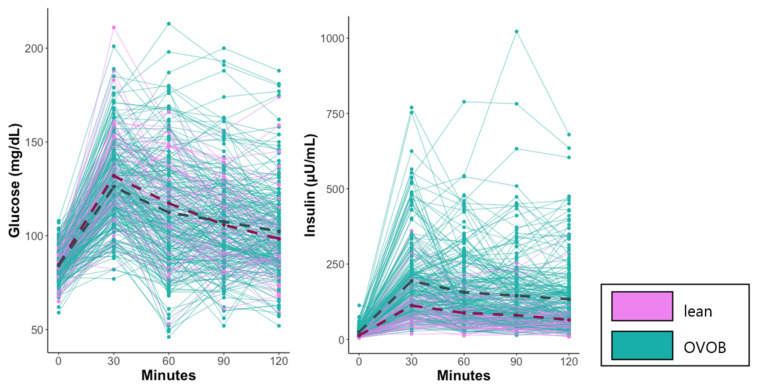
Figure 2.
Kinetics of blood glucose and insulin response to the glucose test at the Fasted Visit. OVOB and lean participants arrived fasted prior to the consumption of the glucose challenge. Blood glucose and insulin were profiled before and during the OGTT. Mean values reported for lean (dark pink dash) and OVOB (dark slate gray dash). OVOB, overweight and obese.

