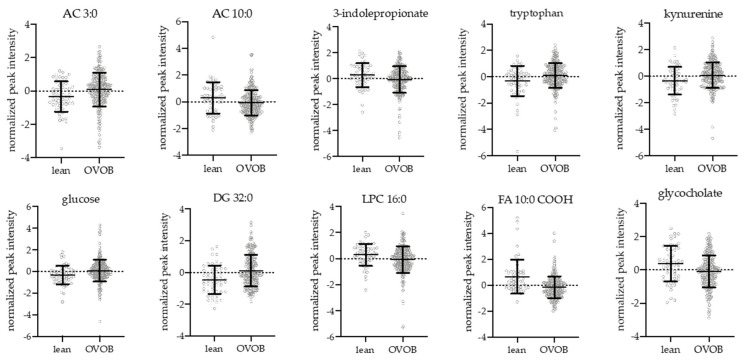
Figure 3.
Differential metabolites between OVOB and lean participants during the Fasted OGTT Challenge. Linear regression analyses identified metabolites associated with the OVOB and lean groups at t0 (ßgroup), adjusting for sex and age (FDR < 0.1, 66 metabolites). Selected differential metabolites represent metabolic pathways associated with obesity at t0. Normalized peak intensities and standard deviations are reported.

