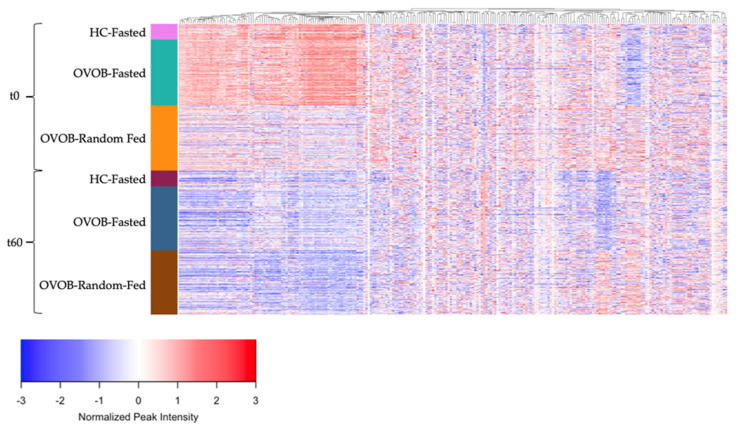
Figure 4.
Dynamic response of the metabolome to an oral glucose tolerance test. Heatmap of normalized peak intensity for individual metabolites (p = 246) (mean 0, standard deviation 1). Metabolites are grouped by hierarchical clustering (columns). Subjects are ordered by group (OVOB and lean), time point after the OGTT (t0 and t60), and state (Fasted and Random-Fed) (rows). OVOB, overweight and obese.

