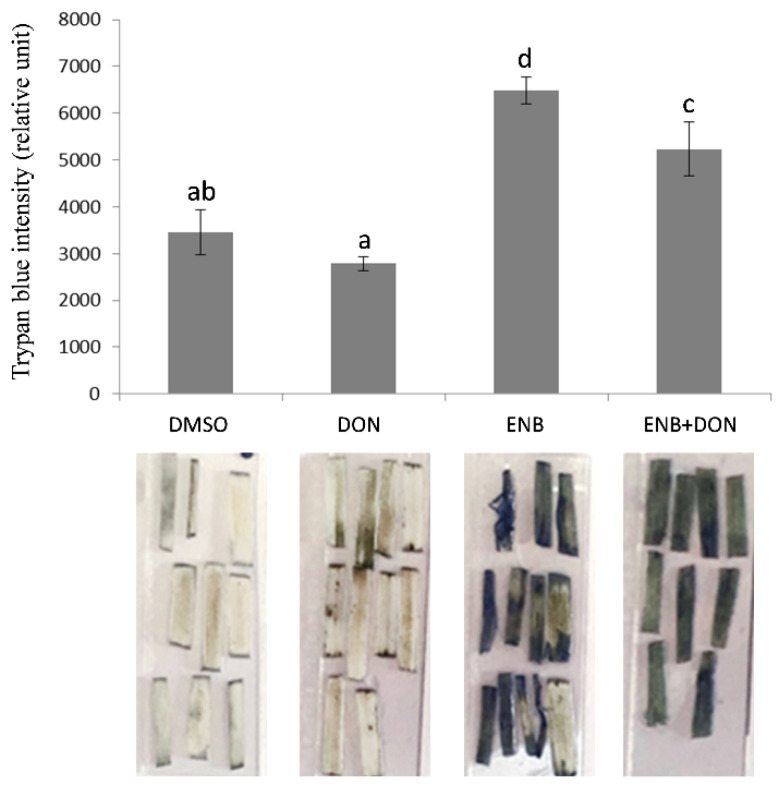
Figure 4.
Quantification of cell death by trypan blue staining after single or combined DON and ENB applications. In all experiments, for each test, the same volume and concentration of DMSO was used as a control. Cell death was assessed by the intensity of trypan blue staining after seven days, as measured by ImageJ software. Data represent the mean ± standard error of three independent experiments with 8–10 leaf segments/treatment for each experiment. Different letters indicate significant differences in mean values (p ≤ 0.01, one-way ANOVA, Tukey’s HSD test). A representative image of stained plant tissues is shown below the histogram.

