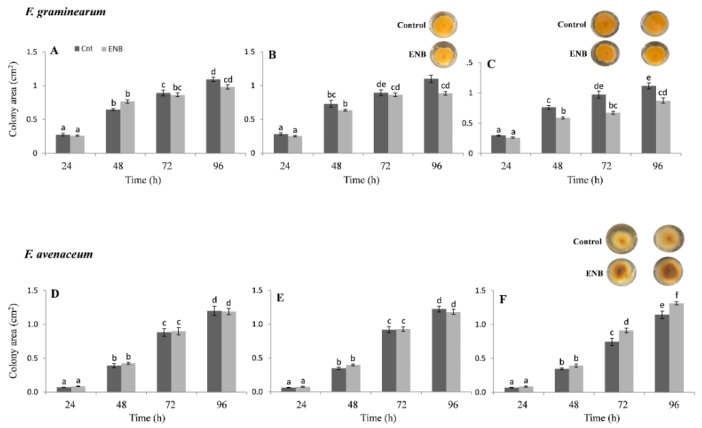
Figure 8.
Effects of three ENB concentrations on the in vitro growth of FG and FA. Seven replicates were performed for each concentration of ENB and its controls. Data represent the mean ± standard error of three independent experiments. Different letters indicate significant differences in mean values (p ≤ 0.01, two-way ANOVA, Tukey’s HSD test). A representative image is provided above the histograms showing statistically significant differences between controls and treatments. (A,D): 10 mg kg−1; (B,E): 50 mg kg−1; (C,F): 100 mg kg−1.

