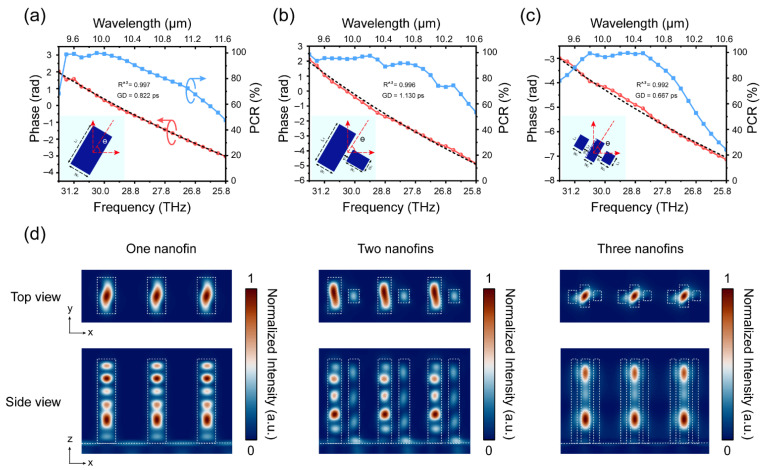
Figure 2.
Simulation results for three selected meta-atoms. (a) PCR and phase spectrum for one nanofin, geometry parameters in the inset picture: L1 = 4.4 μm, W1 = 2.2 μm; (b) PCR and phase spectrum for two nanofins, geometry parameters in the inset picture: L1 = 4.3 μm, W1 = 1.3 μm, g1 = 0.5 μm, L2 = 1.9 μm, W2 = 1.9 μm; (c) PCR and phase spectrum for three nanofins, geometry parameters in the inset picture: L1 = 1.3 μm, W1 = 1 μm, g1 = 0.5 μm, L2 = 2.1 μm, W2 = 1 μm, L3 = 1.1 μm, W3 = 1 μm; (d) top and side views of normalized H field intensities for the three meta-atoms.

