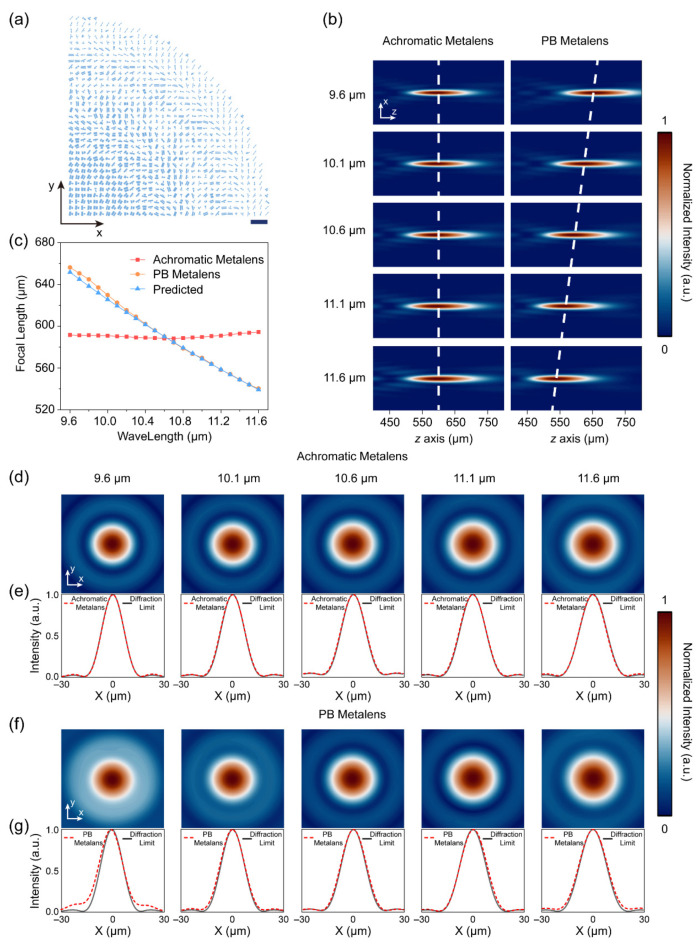
Figure 3.
Layout and simulation results of intensity distributions of the metalenses: (a) layout of the broadband achromatic metalens, scale bar is 20 μm; (b) normalized intensity distribution in the x–z plane for the broadband achromatic metalens (left) and PB metalens (right) at a selected wavelength; (c) focal length as a function of the wavelength for the achromatic and PB metalenses, with the theoretically predicted focal length calculated as for the PB metalens; (d,f) intensity distributions at the focal plane for the broadband achromatic metalens and PB metalens, respectively; (e,g) horizontal cuts (red dashed curves) across the focal spots in (d,f) compared with an ideal Airy spot (black curves).

