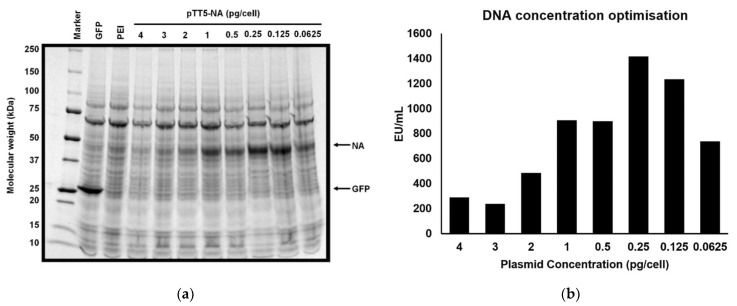
Figure 2.
Optimisation of quantity of DNA in transfection for pTT5-NA (+SS −TET). 80 mL HEK293-6E cells (1 × 10⁶ cells/mL) were transfected with 4, 3, 2, 1, 0.5, 0.25, 0.125 or 0.0625 pg/cell pTT5-NA (+SS −TET) plasmid. Previous trials had been performed at 1 pg/cell. (a) 6 days post transfection cell culture supernatants were analysed by SDS-PAGE for NA expression. The supernatant samples were concentrated 10× before SDS-PAGE analysis. GFP represents a positive control for recombinant protein expression (27 kDa). PEI represents a negative control for recombinant protein expression. Samples were loaded onto SDS-PAGE gel (4–20%) and visualized using Coomassie blue. (b) Reducing the amount of plasmid DNA to 0.25 pg/cell increases NA production. Following transfection with varying amounts of pTT5-NA (+SS −TET), the cell supernatant was analysed after six days of expression to assess NA activity. DNA quantity per cell is shown on the x-axis. NA activity is plotted in EU/mL where 1 EU (enzyme unit) represents the amount of NA required to convert 1 µmol MUNANA to 4-MU per minute.

