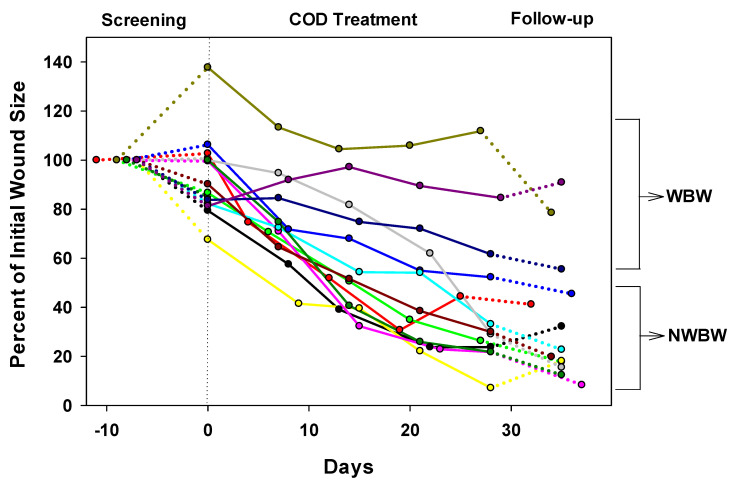
Figure 5.
The sizes of the wounds normalized to the initial wound size per wound healing day for all 13 patients are shown. Day 0 represents the day the COD treatment started. Each color represents a different patient. The continuous line represents the Treatment Phase, which is preceded by the Screening Phase (dotted lines) and followed by the Follow-up Phase (dotted lines). The three upper lines belong to the three patients with weight-bearing wounds (WBW) and the other 10 lines belong to the 10 patients with non-weight-bearing wounds (NWBW). Each circle represents the date when the wound dressing was changed in the clinic and the wound size was measured by the wound imaging artificial intelligence system.

