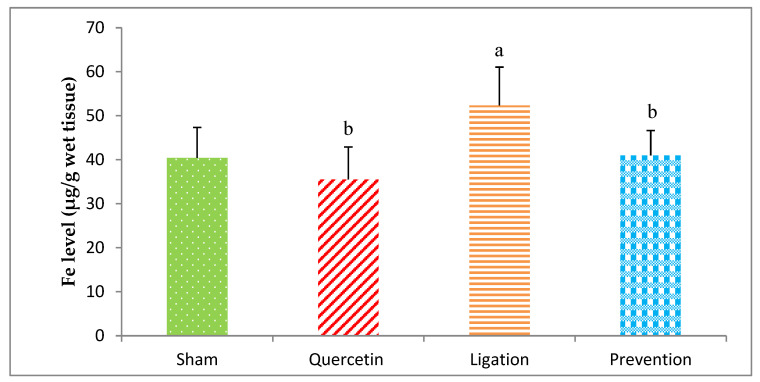
Figure 5.
Iron (Fe) level in the ipsilateral brain cortex homogenates. Data were expressed as the mean ± S.D. The Kruskal–Wallis one-way analysis of variance (ANOVA) followed by Fisher’s Least Significant Difference test were used in this study. Difference of statistic was considered significant at p < 0.05. a: p < 0.05 vs. sham group; b: p < 0.05 vs. ligation group.

