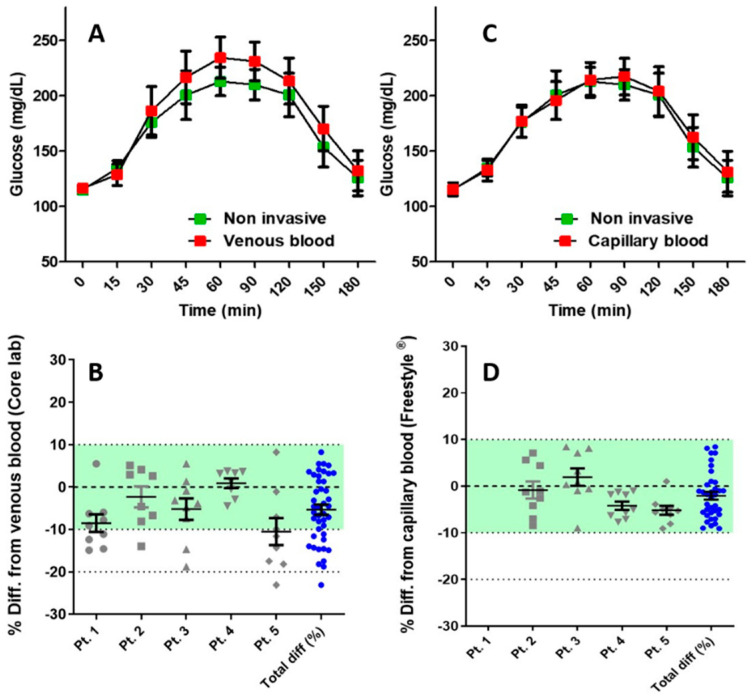
Figure 2.
(A) Comparison of oral glucose tolerance test (oGTT) results between capillary blood (red) and HGR glucose readings (green). (B) Percentage difference of HGR glucose readings versus glucose levels of venous blood measured by the reference laboratory for each subject, and the full cohort. (C) Comparison of oGTT results: Abbott FreeStyle® (red) and HGR (green). (D) Percentage difference of HGR readings versus capillary blood readings by Abbott FreeStyle® glucose meters for each subject and the full cohort.

