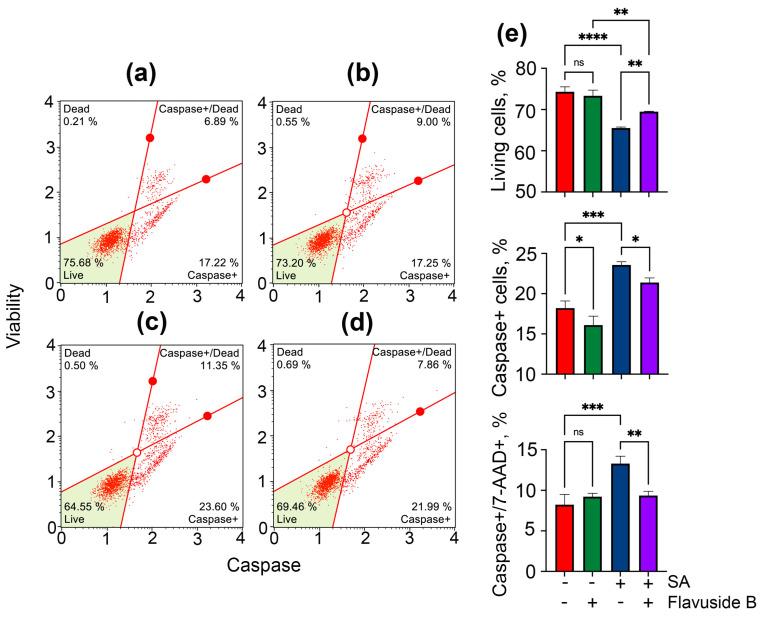
Figure 5.
Influence of flavuside B on caspase activity in HaCaT cell co-cultivated with SA for 40 h. Data of flow cytometry of non-treated HaCaT cells (a), HaCaT cells treated with flavuside B (b), HaCaT cells treated with SA (c), HaCaT cells treated with SA and flavuside B (d) and summarized graph (e). All experiments were performed in three independent replicates. The data presented as mean ± SEM. **** indicates the significant differences with p ≤ 0.0001; *** indicates the significant differences with p ≤ 0.005; ** indicates the significant differences with p ≤ 0.001; * indicates the significant differences with p ≤ 0.05; “ns” indicates that differences are not significant.

