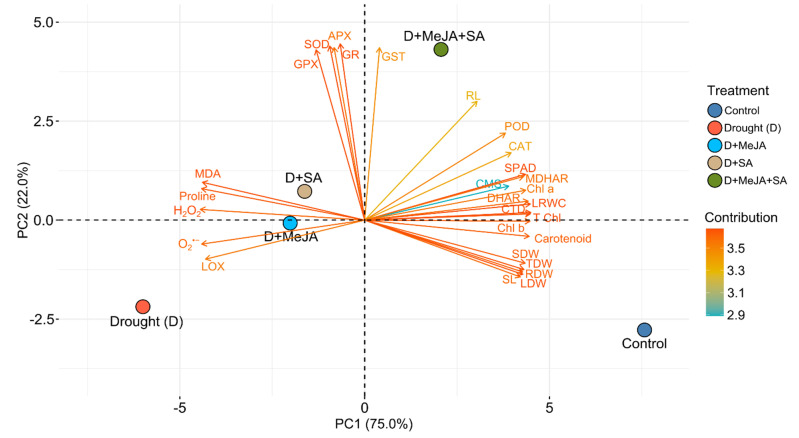
Figure 7.
A PCA biplot stipulates the relationship between treatments and observed parameters. Parameters are distributed in different ordinates depending on the divergence among them. In this biplot, the length and color intensity of a vector indicate the quality of representation and the contribution of the traits to the principal components, respectively. The angles between the vectors formed from the middle point of the biplots indicate whether the traits interacted positively or negatively. Additional details are shown in Figure 1.

