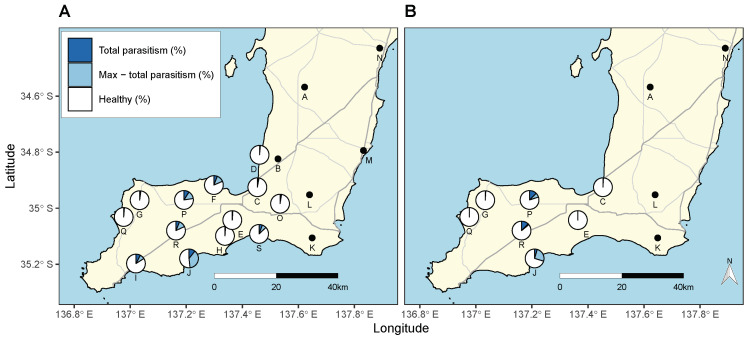
Figure 3.
Geographic map of the Yorke Peninsula, South Australia, showing S. villeneuveana parasitism rates on: (A) C. acuta at 19 sites; and (B) C. barbara at 11 sites. Pies display the total parasitism rate across all sampling dates (dark blue) and the maximum parasitism rate on any single sampling date (light blue and dark blue) at sites where the fly was present. Black dots represent sites where snails were collected but S. villeneuveana was not recovered.

