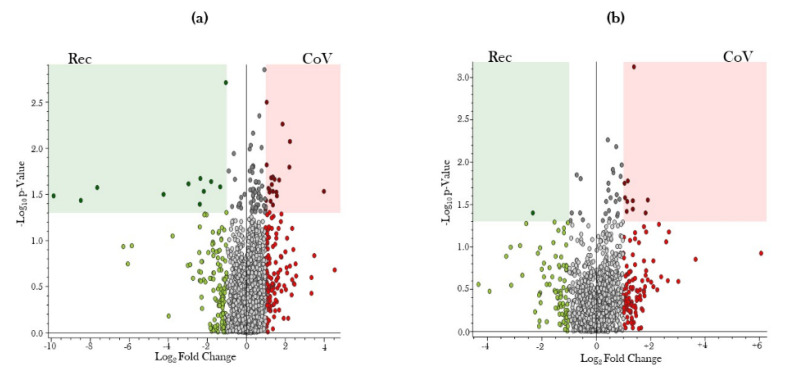
Figure 3.
Volcano plot showing number and distribution of serum metabolites in COVID-19-positive and COVID-19-recovered patients. Serum samples from COVID-19-positive (CoV) and COVID-19-recovered (Rec) patients were obtained, and the serum metabolites were quantitated using ultra-performance liquid chromatography–mass spectrometry (UPLC-MS). The differential expression of serum metabolites among CoV and Rec patients was represented as a volcano plot of –log10 (p-value) (Y-axis) versus log2 (Fold Change) (X-axis) for (a) positive and (b) negative ion modes of UPLC-MS spectra.

