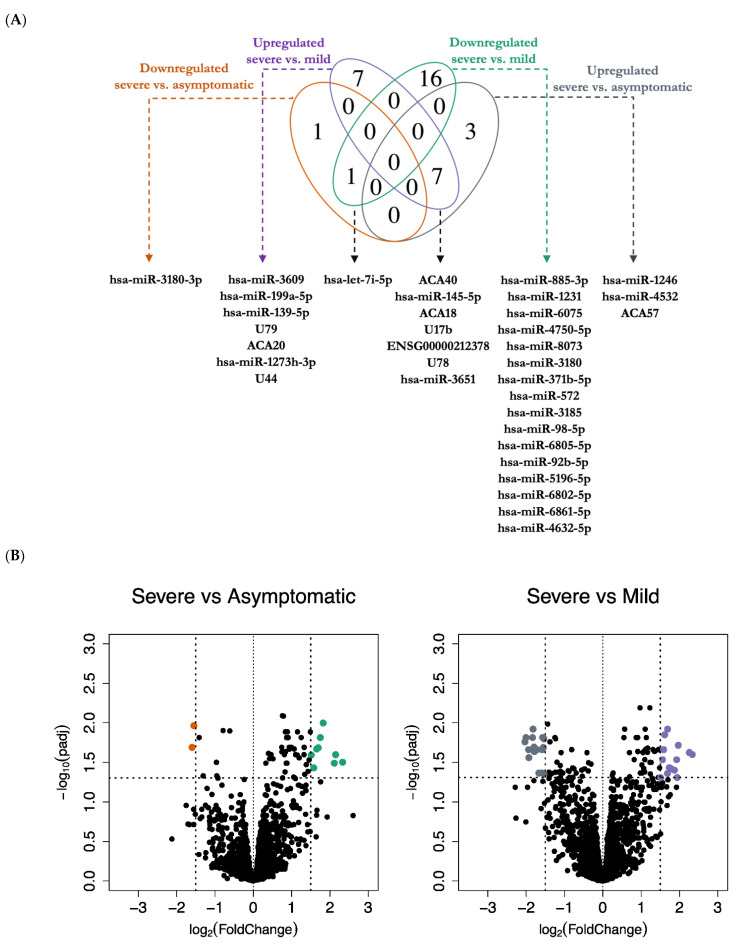
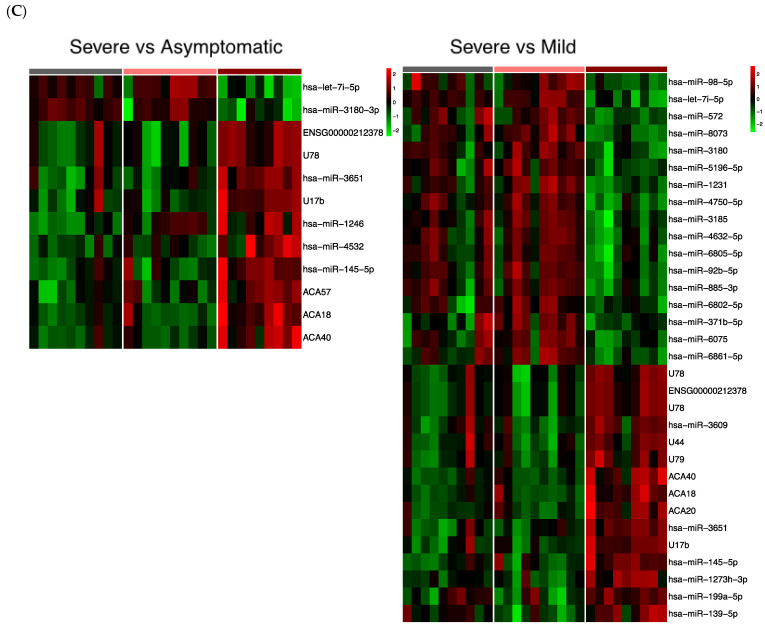
Figure 1.
Differential expression analysis of miRNAs and snoRNAs in asymptomatic, mild, and severe COVID-19 patients. (A) A Venn diagram of the number of unique and common differentially expressed miRNAs and snoRNAs in severe versus asymptomatic (D: grey: upregulated, A: orange: downregulated), and in severe versus mild (C: purple: upregulated, B: green: downregulated). The overlap of the two ovals with upregulated transcripts represents 7 miRNAs and snoRNAs shared between the two upregulated lists, and the two ovals with downregulated transcripts represent 1 miRNA shared between the two downregulated lists. The areas of no overlap represent the number of uniquely (not shared) miRNAs/snoRNAs in each respective comparison, namely 4 in severe versus asymptomatic, and 23 miRNAs/snoRNAs in severe versus mild comparison. (B) Volcano plots of differentially expressed miRNAs and snoRNAs, with y-axis as-log10 adjusted p-value (adjusted for multiple testing with the Benjamini–Hochberg procedure) and x-axis as the log2-fold change. The vertical lines represent a threshold of |log2-fold change| > 1.5, either upregulated (right side) or downregulated (left side), while the horizontal lines represent an FDR < 0.05. Each colored point represents an individual probe in severe versus asymptomatic comparison (D: green: upregulated, A: orange: downregulated), and in severe versus mild comparison (C: purple: upregulated, B: grey: downregulated). (C) Hierarchical clustering of Log2 normalized expression values of the differentially expressed miRNAs and snoRNAs in severe versus asymptomatic comparison (n = 25), and in severe versus mild (n = 50).


