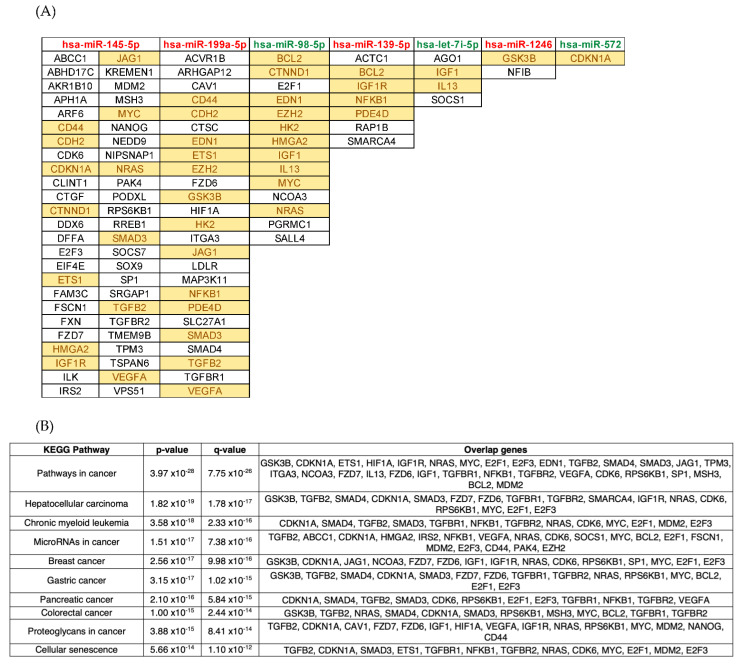
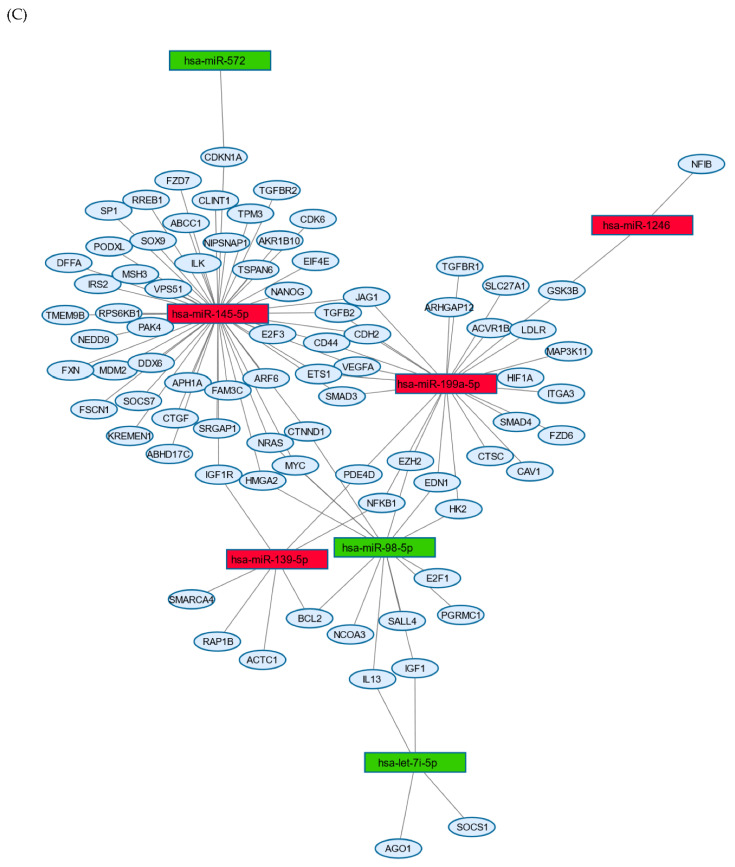
Figure 2.
Functional and pathway enrichment analyses using a list of common differentially expressed miRNAs shared by severe versus asymptomatic, and severe versus mild comparisons. (A) Representation of differentially expressed miRNAs and their associated target genes. The name of the miRNA is highlighted in red for upregulated, and in green for downregulated, whereas target genes that are highlighted in yellow are those that are targeted by more than 1 miRNA. (B) KEGG enrichment analysis with the names of top 10 significant deregulated pathways for KEGG 2021 Human database. The q-value is an adjusted p-value calculated using the Benjamini–Hochberg method for correction for multiple hypotheses testing. (C) Network-based visualization of differentially expressed miRNAs and their associated target genes, where red/green nodes represent the upregulated/downregulated miRNA, and the blue nodes represent its targeted gene.


