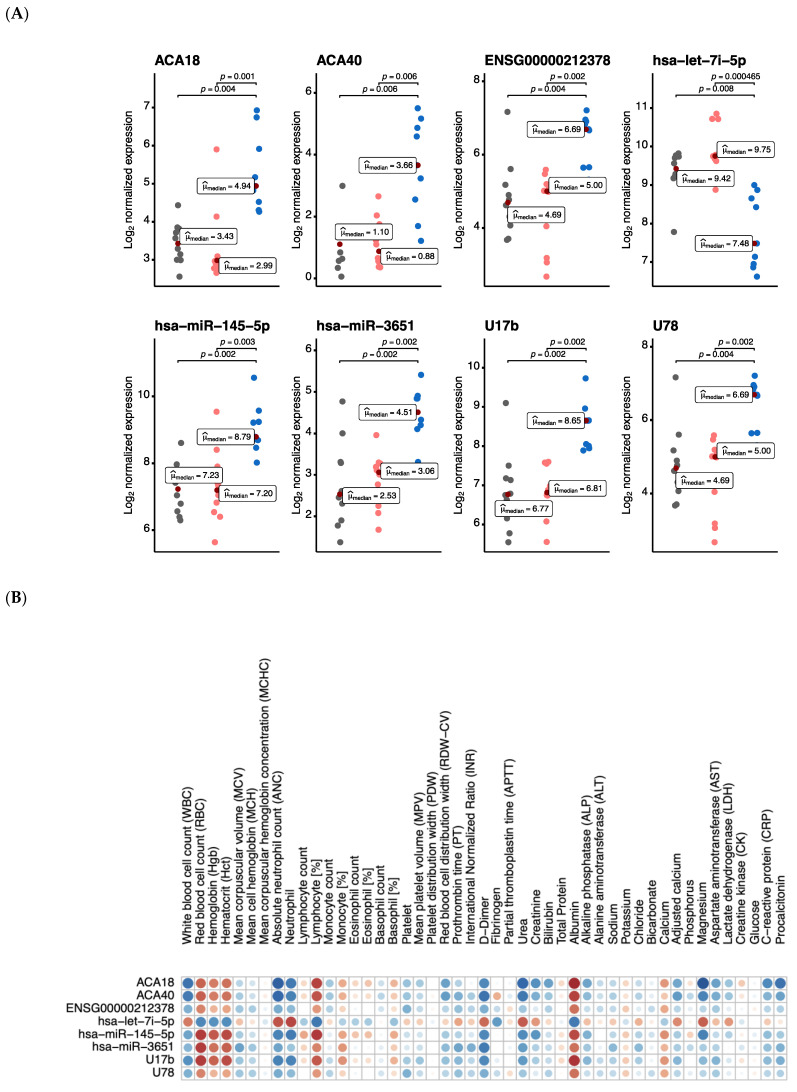
Figure 3.
Association of routine clinical markers with differentially expressed common miRNAs and snoRNAs. (A) Scatter plots of Log2 normalized expression values of miRNAs and snoRNAs in asymptomatic (n = 10, grey), mild (n = 10, light orange), and severe (n = 9, blue) cases. The comparison between different severity groups was done using the non-parametric Kruskal–Wallis one-way ANOVA test, the median for asymptomatic, mild, and severe groups is reported as a measure of centrality in each scatter plot. In each respective comparison, the p-adjusted values were calculated using Holm’s sequential Bonferroni procedure for multiple hypothesis tests at an alpha level of 0.05. (B) A correlation matrix of the 8 miRNAs and snoRNAs with associated clinical markers. Each cell contains a correlation coefficient between the possible pairs of variables, namely Spearman’s rho statistic calculated at a significance level of 0.05. Color scale ranges from blue (r = −1) to white (r = 0) to red (r = 1).

