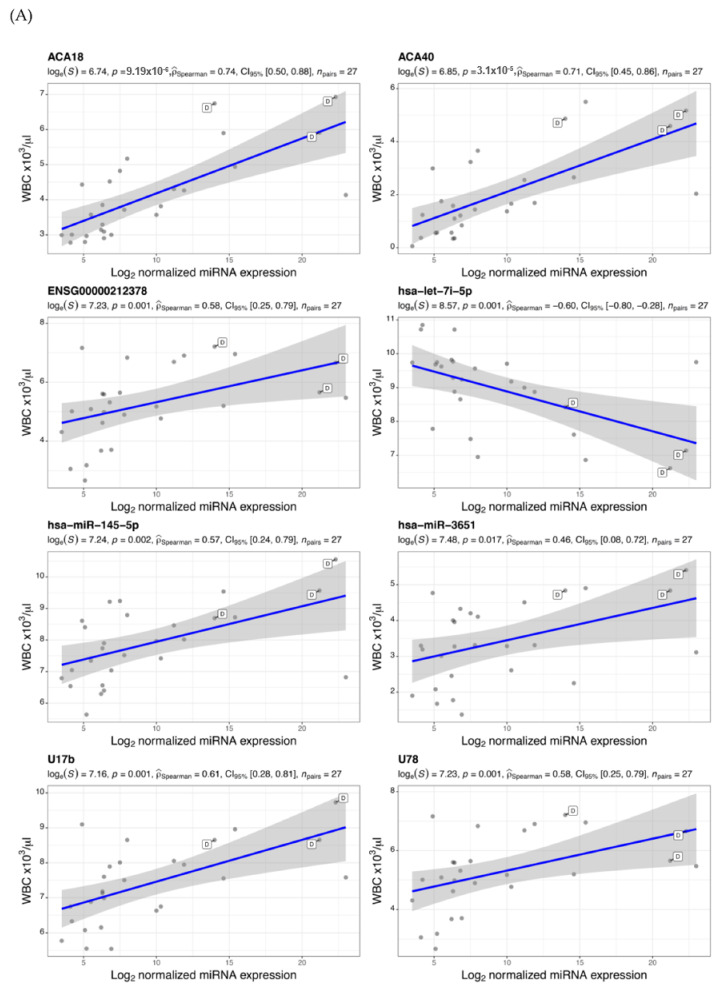
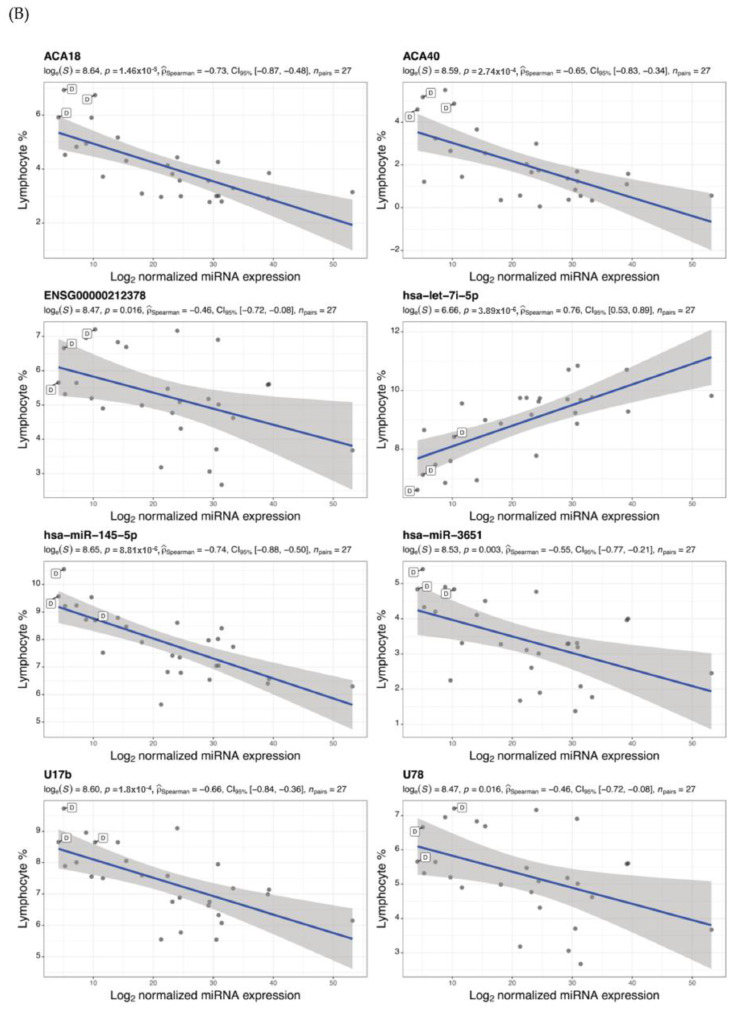
Figure 4.
Correlation of (A) WBC count and (B) lymphocytes (%) with levels of common differentially expressed miRNAs and snoRNAs. Scatter plots x-axis represents Log2 normalized miRNA expression level and y-axis as the clinical marker measurement. Each dot represents a single miRNA transcript, and those tagged with D letter show a deceased patient measurement. For all statistical tests in the plots, the APA standard for statistical reporting is shown for Spearman correlation test including evidence in favor of null over alternative hypothesis, natural logarithm of Bayes Factor, p-value, Spearman’s rank correlation coefficient, confidence intervals, and number of observations.


