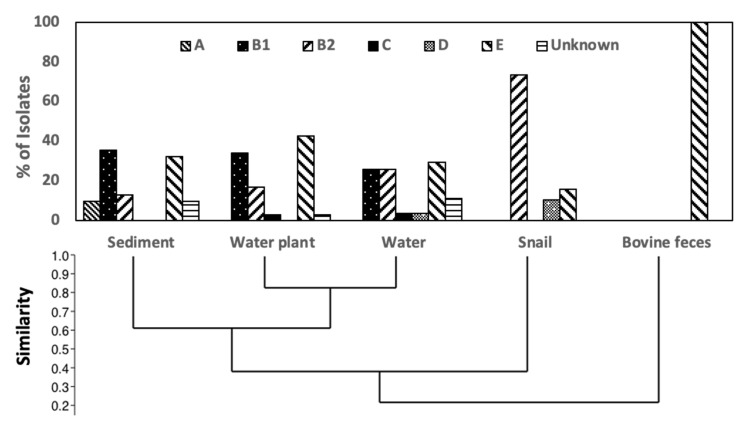
Figure 1.
Phylogroup distribution across isolates from the five sample types. Phylogrouping was performed according to the scheme of Clermont et al., 2013 [6]. The relatedness between Phylogroup distribution similarity was determined by UPGMA using the constrained Jaccard coefficient.

