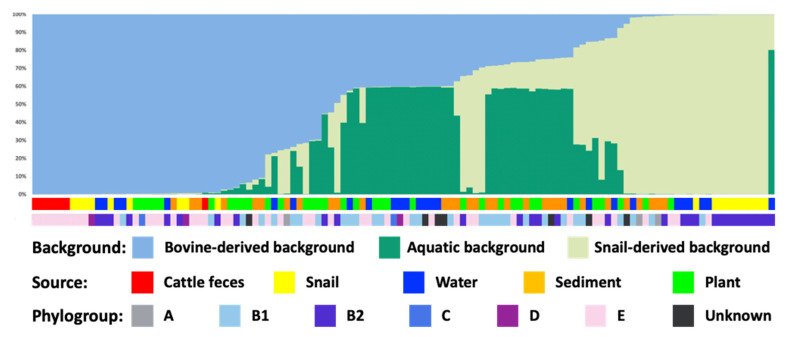
Figure 3.
Population structure analysis of E. coli isolates. Concatenated uidA and mutS sequences were analyzed assuming presence of two populations, but analysis using Structure Harvester showed that K = 3 best explained the data. The short color bars below the figure indicate the isolate source as defined in the legend.

