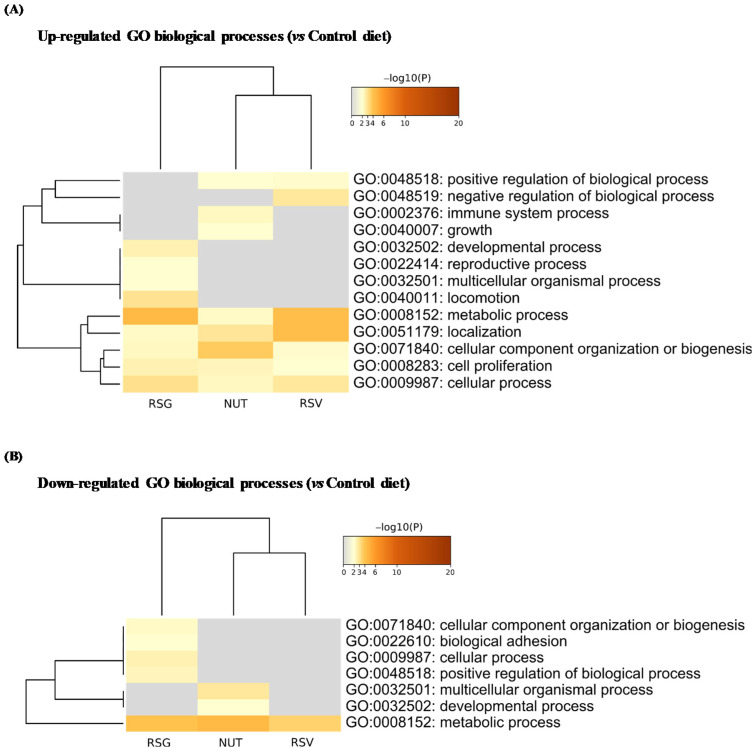
Figure 4.
Enrichment analysis of Gene Ontology (GO) biological processes in differentially up- and down-regulated proteins from lasered mice retina. Based on ANOVA results, t-tests with Welch correction were further applied to identify significantly up- and down-regulated proteins in RSG, NUT, and RSV as compared with the control diet group (Co). Metascape database was then used to identify Gene Ontology (GO) enriched biological processes in up- (A) and down-regulated DEPs (B). Heatmaps show the top enrichment biological processes in up-regulated (A) and down-regulated DEP (B) term clusters, colored by −log10 (p-value). Threshold: 0.3 kappa score; similarity score > 0.3. The darker the orange is, the more significant the term. Gray color indicates a lack of significance.

