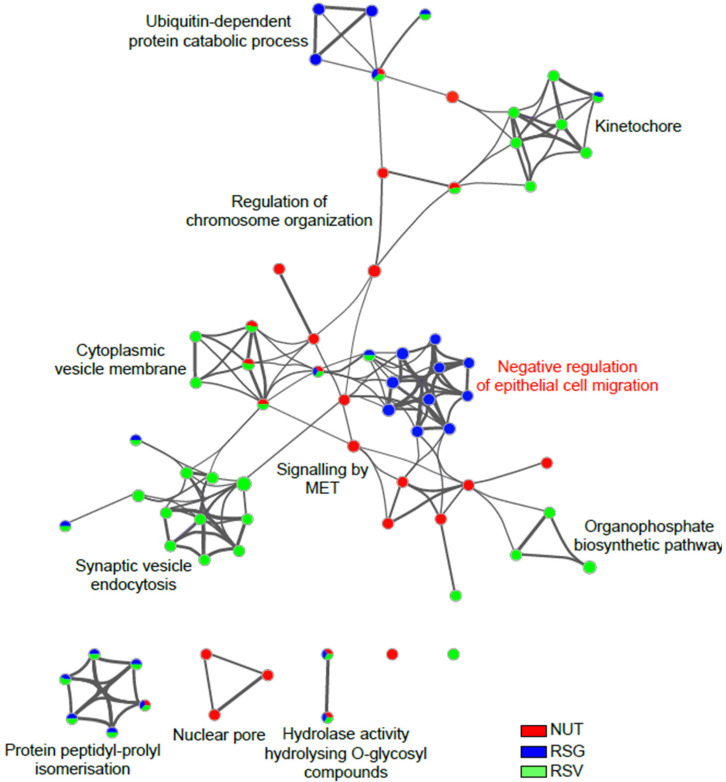
Figure 6.
Network visualization of Gene Ontology (GO) molecular function clusters in differentially down-regulated proteins from lasered mice retina. Enriched terms in significantly down-regulated proteins in RSG, NUT, and RSV groups compared with the control diet group (Co) were selected and rendered as a network plot to further determine the relationship among terms, where terms with similarity of >0.3 were connected by edges. The network of enriched sets colored according to experimental group identity was visualized with Cytoscape (v3.1.2) with “force-directed” layout and with bundled edges. The size of a node is proportional to the number of input DEPs that fall into the term and slices within each node represents the number of proteins under the term that originate from each experimental diet group.

