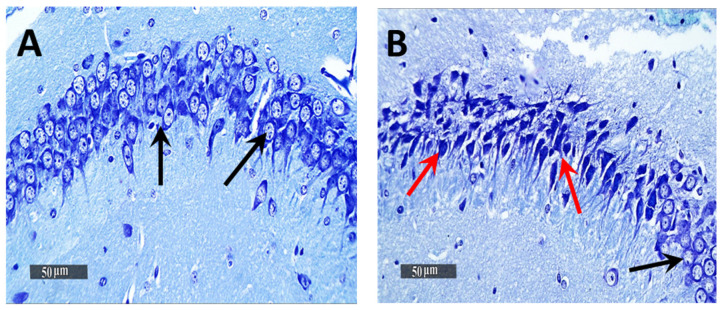
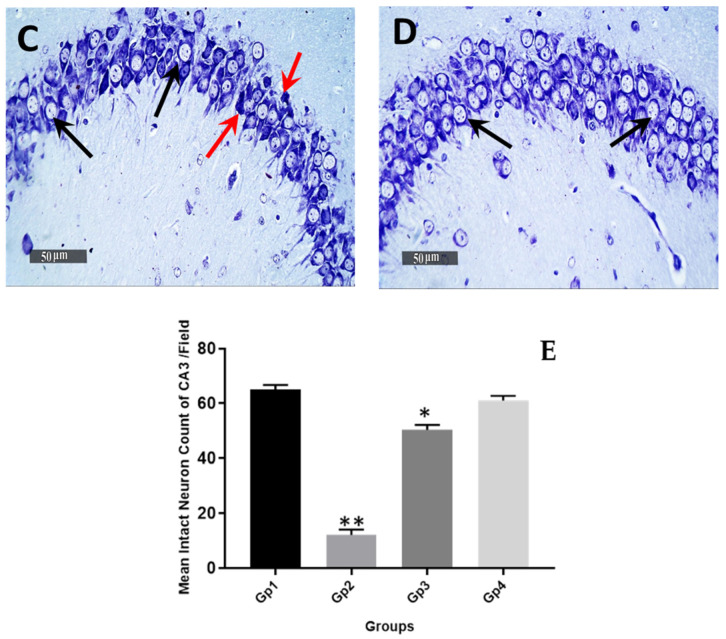
Figure 6.
Light-microscopic examination of toluidine blue-stained pyramidal neurons in CA3/hippocampal sub-regions in different groups. (A) normal group, (B) negative control group (received 0.9% saline), (C) positive control group (received resveratrol suspension) and (D) test group (received resveratrol bilosomes). 400×. Black arrows = intact neurons, Red arrows = damaged neurons. The bar chart (E) shows the mean ± SD of the intact neuron count of CA3 in different groups where Gp 1 represents the normal group, Gp 2, Gp 3 and Gp 4 represent the negative control group (received 0.9% saline), positive control group (received resveratrol suspension) and test group (received resveratrol bilosomes), respectively, where (*) and (**) indicate statistically significantly different values from the control group at (p < 0.05 and p < 0.01), respectively.


