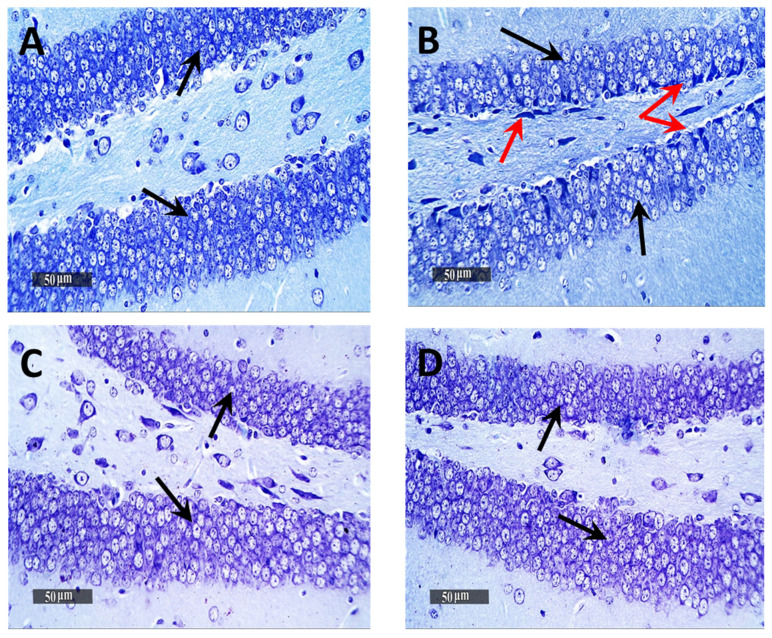
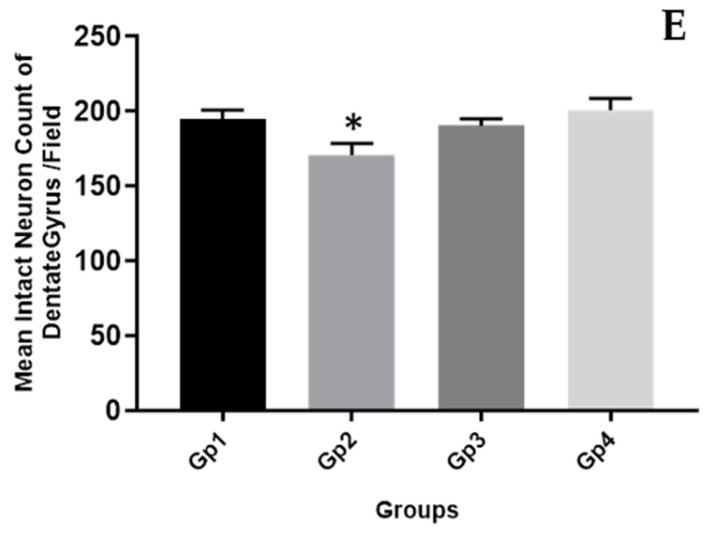
Figure 8.
Light-microscopic examination of toluidine blue-stained pyramidal neurons in Dentate Gyrus/hippocampal subregions in different groups. (A) Normal group, (B) Negative control group, (C) Positive control group and (D) Test group 400×, Black arrows = intact neurons, Red arrows = damaged neurons. The bar chart (E) shows the mean ± SD of the intact neuron count of Dentate Gyrus, where Gp 1 represents the normal group, Gp 2, Gp 3 and Gp 4 represent the negative control group (reveived 0.9% saline), positive control group (received resvertrol suspension) and test group (received resveratrol bilosomes), respectively. * indicates statistically signifcantly different values from the control group (Gp 1) at p < 0.05.


