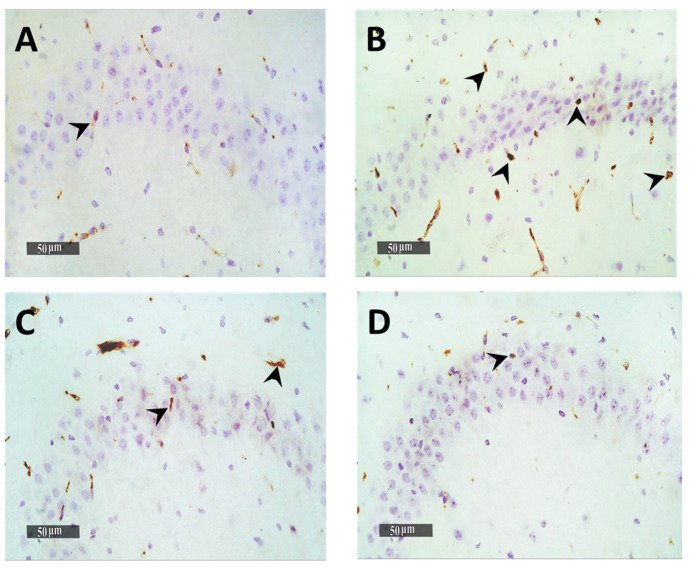
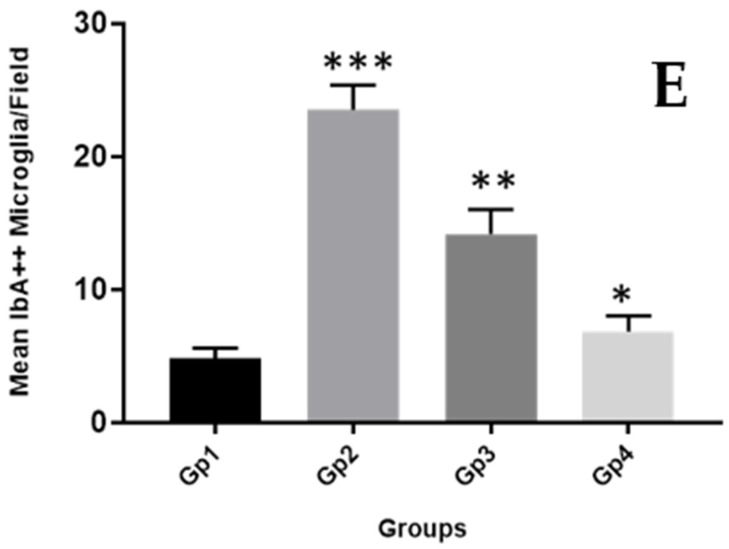
Figure 10.
Effect of different treatments on hippocampal IbA/++ activated microglial cells count expressed as the mean number of IbA/++ cells per microscopic field. (A) Normal group, (B) Negative control group, (C) Positive control group and (D) Test group. 400×. The bar chart (E) shows the mean ± SD of the % area of immuno-histochemical levels expression of GFAP, where Gp 1 represents the normal group, Gp 2, Gp 3 and Gp 4 represent the negative control group (received 0.9% saline), positive control group (received resveratrol suspension) and test group (received resveratrol bilosomes), respectively, where (*), (**) and (***) indicate statistically significantly different values from the control group at (p < 0.05, p < 0.01 and p < 0.001), respectively.


