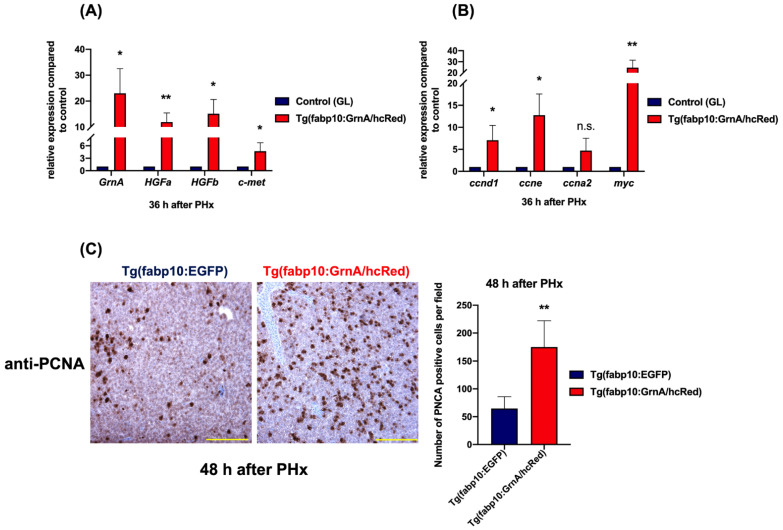
Figure 6.
Liver-specific overexpression of GrnA positively regulated the HGF/c-met axis in hepatectomized zebrafish. (A) Quantitative PCR analysis of zebrafish GrnA, HGFa, HGFb, and c-met in hepatectomized zebrafish at 36 h after PHx. (B) The cell cycle regulatory genes (ccnd1, ccne, and ccna2) and cell proliferation-associated gene, myc, were examined by quantitative PCR. The relative expression levels compared to control group are presented as mean ± SD. EF1a served as the internal control. (C) Immunohistochemistry staining of PCNA in liver ventral lobe at 48 h after PHx. Scale bar: 50 μm. Number of PCNA-positive cells was quantified using ImageJ. The data are presented as mean ± SD. Significance was set at * p < 0.05, ** p < 0.01, as determined by t-test; PHx, partial hepatectomy; GL, green liver transgenic line.

